> ## Documentation Index
> Fetch the complete documentation index at: https://projectdiscovery-feat-gsoc.mintlify.site/llms.txt
> Use this file to discover all available pages before exploring further.
# Platform Integrations
> Technical guide for configuring third-party integrations for cloud assets, vulnerability scanning, alerts, and ticketing
## Notification Integrations
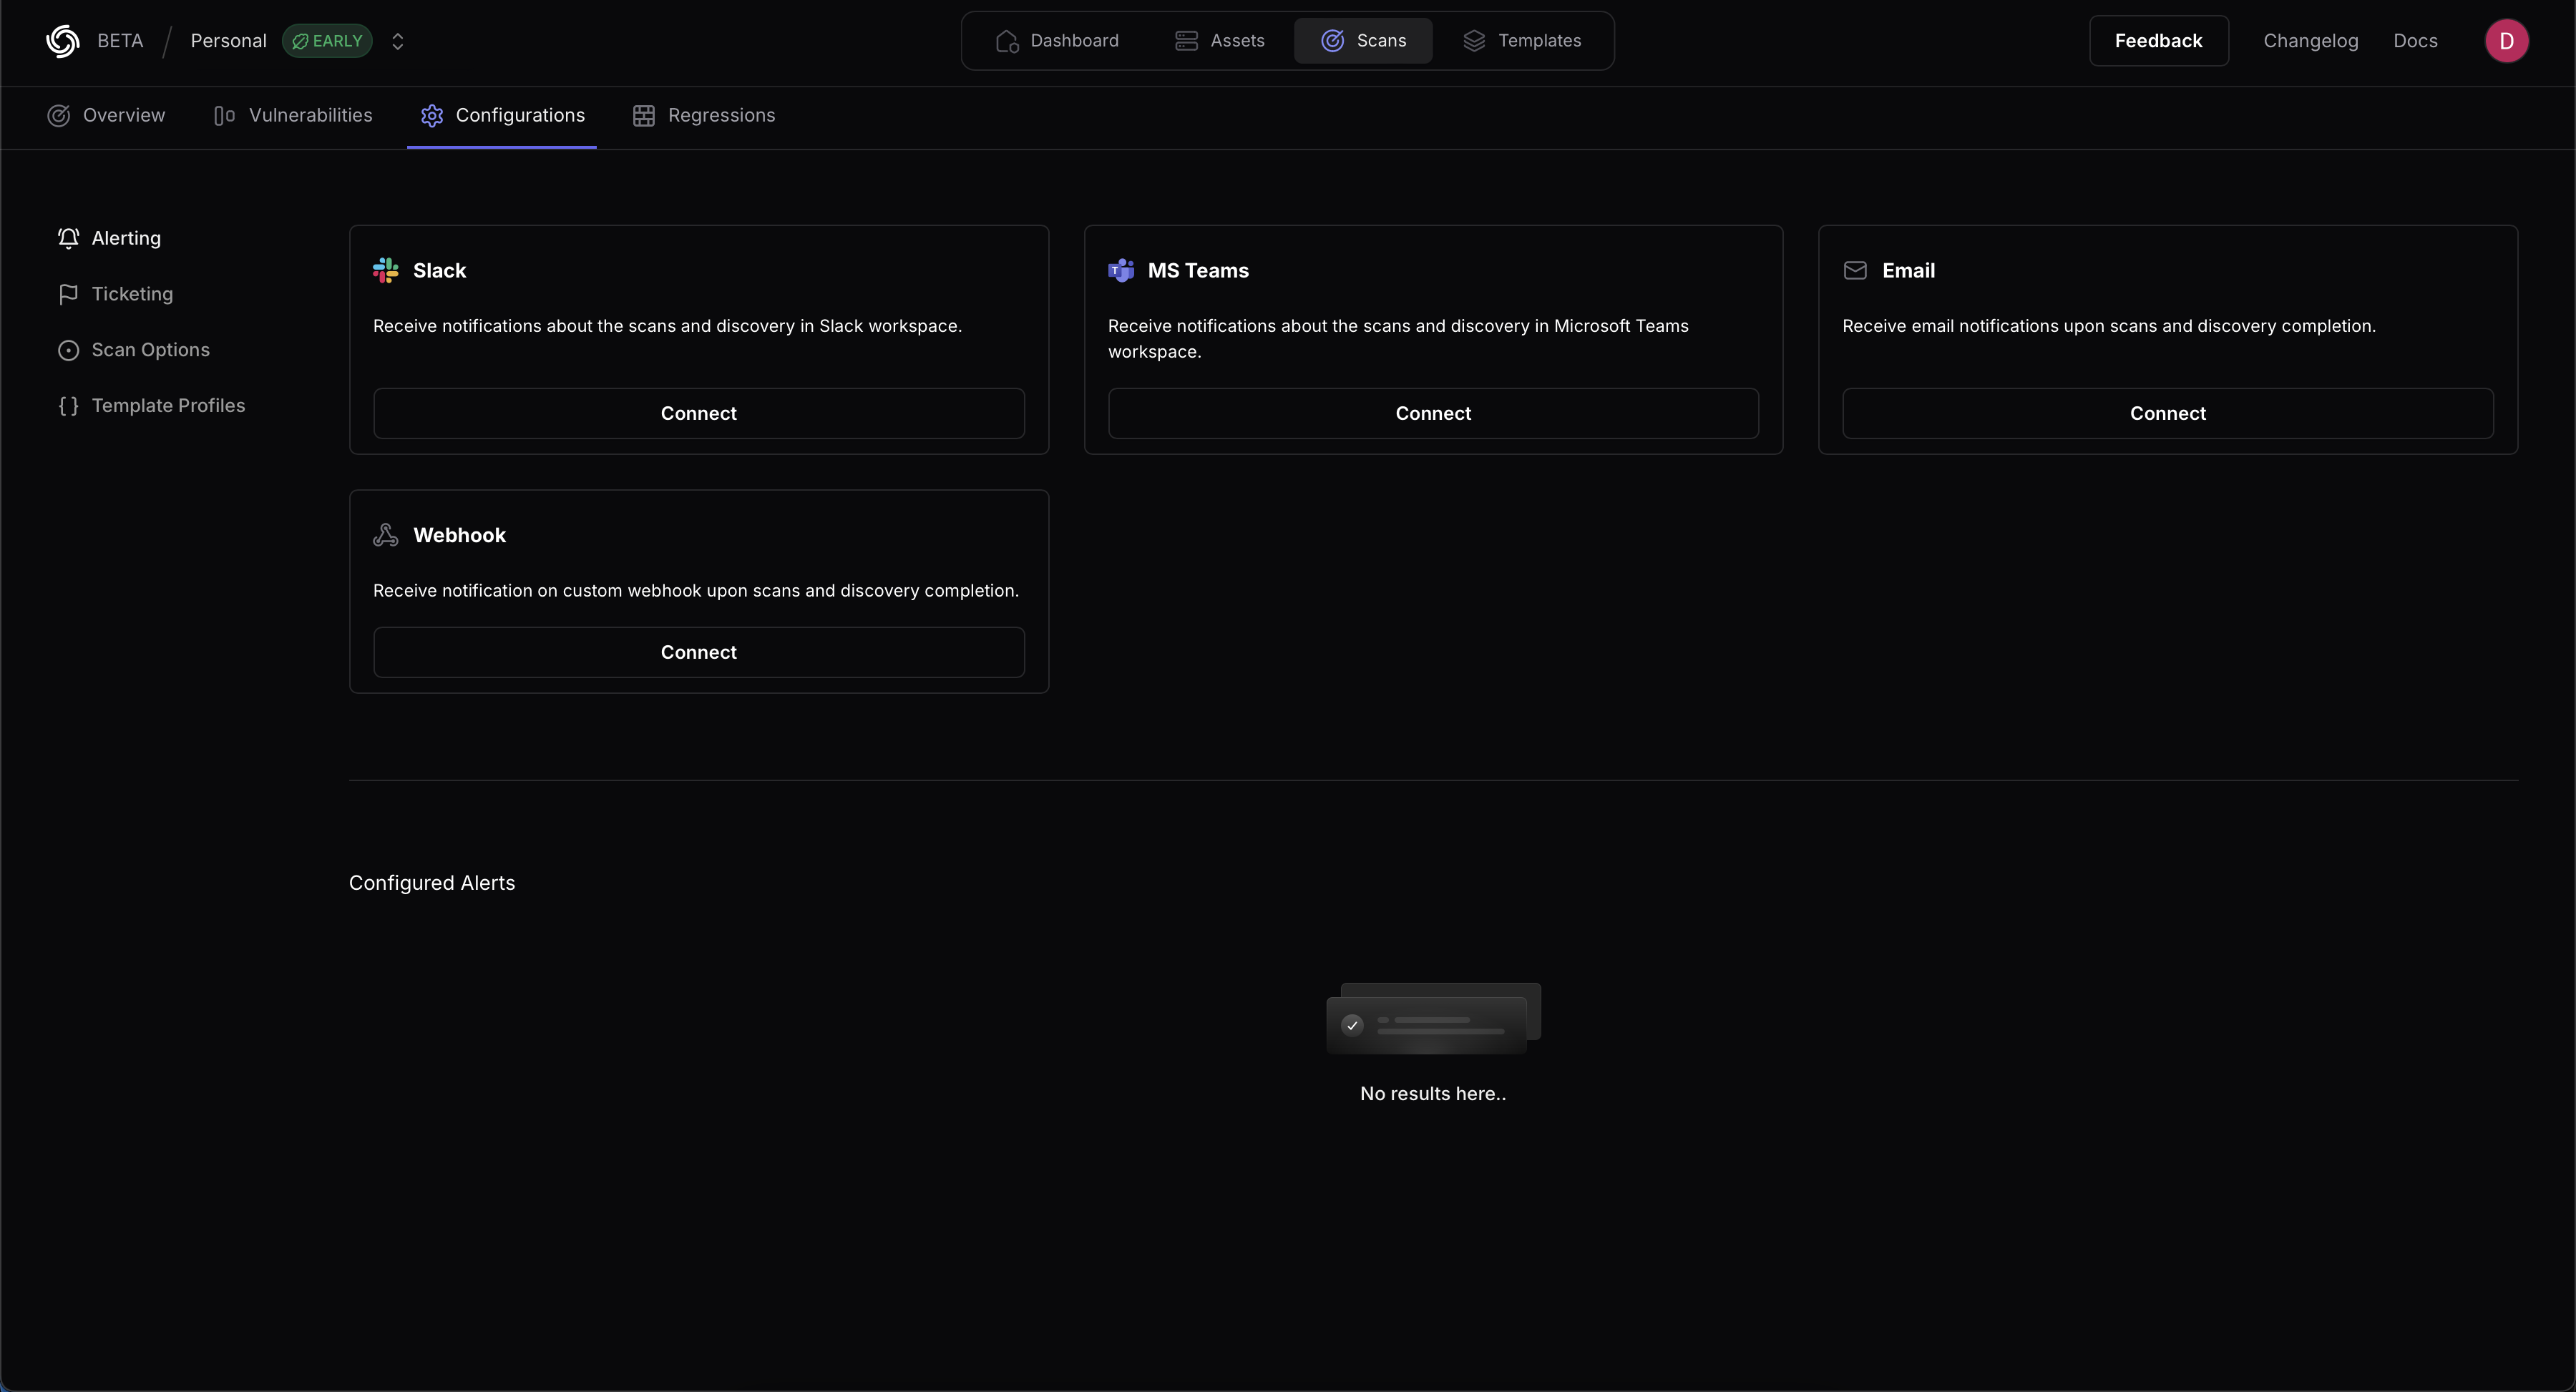
Alerting integrations support notifications as part of scanning and asset discovery, and include Slack, Microsoft Teams, Email, and custom Webhooks. Navigate to [Scans → Configurations → Alerting](https://cloud.projectdiscovery.io/scans/configs) to configure your alerts.
 ### Slack
ProjectDiscovery supports scan notifications through Slack. To enable Slack notifications provide a name for your Configuration, a webhook, and an optional username.
Choose from the list of **Events** (Scan Started, Scan Finished, Scan Failed) to specify what notifications are generated. All Events are selected by default
* Refer to Slack's [documentation on creating webhooks](https://api.slack.com/messaging/webhooks) for configuration details.
### MS Teams
ProjectDiscovery supports notifications through Microsoft Teams. To enable notifications, provide a name for your Configuration and a corresponding webhook.
Choose from the list of **Events** (Scan Started, Scan Finished, Scan Failed) to specify what notifications are generated.
* Refer to [Microsoft's documentation on creating webhooks](https://learn.microsoft.com/en-us/microsoftteams/platform/webhooks-and-connectors/how-to/add-incoming-webhook?tabs=newteams%2Cdotnet) for configuration details.
### Email
ProjectDiscovery supports notifications via Email. To enable email notifications for completed scans simply add your recipient email addresses.
### Webhook
ProjectDiscovery supports custom webhook notifications, allowing you to post events to any HTTP endpoint that matches your infrastructure requirements.
**Quick Setup**
1. Navigate to [Scans → Configurations → Alerting](https://cloud.projectdiscovery.io/scans/configs)
2. Select "Webhook" integration
3. Provide your endpoint URL and optional authentication
4. Choose which events to receive (New Asset, New Vulnerability, Scan/Asset Finished/Failed)
5. Select severity filters (optional)
**Configuration Requirements:**
A descriptive name for your webhook configuration
Your HTTPS endpoint that will receive POST requests
Example: `https://your-domain.com/api/security/alerts`
#### Event Types Overview
ProjectDiscovery sends webhook notifications as **HTTP POST requests** with `Content-Type: application/json`. Each scan or enumeration job triggers multiple webhooks throughout its lifecycle.
Track vulnerability scan lifecycle from start to completion
Started (`running`)
Finished (`finished`)
Failed (`failed_stopped`)
Monitor asset discovery operations in real-time
Started (`running`)
Finished (`finished`)
Failed (`failed_stopped`)
Alerts when new vulnerabilities are found (rescans only)
Type: `new_vuln`
Triggered at end of scan when comparing results
Alerts when new assets are discovered in your attack surface
Type: `new_asset`
Triggered at end of disocvery or scan
**Event Filtering:** Configure which events and severity levels trigger webhooks in your integration settings. This helps reduce noise and focus on what matters most to your team.
**Scan and Discovery lifecycle events** trigger **3 separate webhook calls**: one when it starts (`running`), one when it completes (`finished` or `failed_stopped`). Only the relevant data object is populated in each webhook - the others will be `null`.
**New Vulnerability and New Asset alerts** are single webhooks sent only when new items are discovered (at the end of scan/enumeration).
***
#### Webhook Payload Reference
Select a scan event to view its webhook payload structure:
**Trigger:** Immediately when a vulnerability scan begins execution
**Type:** `running`
```json Scan Started Payload theme={null}
{
"type": "running",
"message": "Scan started successfully",
"scan_name": "Production API Security Scan",
"scan_id": "scan-abc123",
"running": {
"started_at": "2025-11-20T14:30:00Z",
"total_targets": 150,
"total_templates": 85,
"total_requests": 12750
},
"finished": null,
"failed_stopped": null
}
```
**Root Fields:**
* `type` — Always `"running"` for this event
* `message` — Human-readable status message
* `scan_name` — Name of the scan configuration
* `scan_id` — Unique identifier for this scan execution
**Running Object:**
* `started_at` — ISO 8601 timestamp when scan started
* `total_targets` — Number of targets to scan (integer)
* `total_templates` — Number of templates being used (integer)
* `total_requests` — Estimated total HTTP requests (integer)
**Trigger:** When a vulnerability scan completes successfully
**Type:** `finished`
```json Scan Finished Payload theme={null}
{
"type": "finished",
"message": "Scan completed successfully",
"scan_name": "Production API Security Scan",
"scan_id": "scan-abc123",
"running": null,
"finished": {
"finished_at": "2025-11-20T15:45:00Z",
"scan_time": "4500s",
"total_matches": 23,
"severity_breakdown": {
"critical": 5,
"high": 8,
"medium": 6,
"low": 3,
"info": 1
},
"rescan_new_vulnerabilities": 3,
"rescan_vulns_list": [
{
"Name": "Apache HTTP Server 2.4.49 - Path Traversal",
"Severity": "critical",
"Count": 2
},
{
"Name": "SQL Injection in /api/login",
"Severity": "high",
"Count": 1
}
]
},
"failed_stopped": null
}
```
**Root Fields:**
* `type` — Always `"finished"` for this event
* `message` — Human-readable status message
* `scan_name` — Name of the scan configuration
* `scan_id` — Unique identifier for this scan execution
**Finished Object:**
* `finished_at` — ISO 8601 timestamp when scan completed
* `scan_time` — Total duration in seconds (e.g., "4500s")
* `total_matches` — Total vulnerabilities found (integer)
* `severity_breakdown` — Count by severity level (object)
* `critical` — Critical severity count
* `high` — High severity count
* `medium` — Medium severity count
* `low` — Low severity count
* `info` — Info severity count
* `rescan_new_vulnerabilities` — New vulns since last scan, rescans only (integer)
* `rescan_vulns_list` — List of new vulnerabilities, **max 15 items**, rescans only (array)
* `Name` — Vulnerability name/title
* `Severity` — Severity level (critical, high, medium, low, info)
* `Count` — Number of instances found
**Truncation:** The `rescan_vulns_list` is limited to **15 items** for webhook delivery. For the complete vulnerability list, fetch full scan results via the API.
**Severity Filtering:** If you configured severity filters in webhook settings, only matching vulnerabilities will be included in counts and lists.
**Trigger:** When a scan fails or is manually stopped
**Type:** `failed_stopped`
```json Scan Failed Payload theme={null}
{
"type": "failed_stopped",
"message": "Scan failed due to error",
"scan_name": "Production API Security Scan",
"scan_id": "scan-abc123",
"running": null,
"finished": null,
"failed_stopped": {
"timestamp": "2025-11-20T15:20:00Z",
"progress": 67,
"failure_reason": "Network timeout connecting to target hosts"
}
}
```
**Root Fields:**
* `type` — Always `"failed_stopped"` for this event
* `message` — Human-readable status message
* `scan_name` — Name of the scan configuration
* `scan_id` — Unique identifier for this scan execution
**Failed/Stopped Object:**
* `timestamp` — ISO 8601 timestamp when failure occurred
* `progress` — Completion percentage (0-100) when failed (integer)
* `failure_reason` — Description of why scan failed or was stopped (string)
Select an Discovery event to view its webhook payload structure:
**Trigger:** When asset discovery begins
**Type:** `running`
```json Enumeration Started Payload theme={null}
{
"type": "running",
"message": "Enumeration started successfully",
"enumeration_name": "Weekly Asset Discovery",
"enumeration_id": "enum-xyz789",
"running": {
"started_at": "2025-11-20T10:00:00Z"
},
"finished": null,
"failed_stopped": null
}
```
**Root Fields:**
* `type` — Always `"running"` for this event
* `message` — Human-readable status message
* `enumeration_name` — Name of the enumeration configuration
* `enumeration_id` — Unique identifier for this enumeration execution
**Running Object:**
* `started_at` — ISO 8601 timestamp when enumeration started
**Trigger:** When asset disocvery completes successfully
**Type:** `finished`
```json Enumeration Finished Payload theme={null}
{
"type": "finished",
"message": "Enumeration completed successfully",
"enumeration_name": "Weekly Asset Discovery",
"enumeration_id": "enum-xyz789",
"running": null,
"finished": {
"finished_at": "2025-11-20T10:30:00Z",
"enumeration_time": "1800s",
"total_assets": 247,
"new_assets": 5,
"new_assets_list": [
{
"host": "api-v2.example.com",
"port": 443,
"ip": ["192.168.1.50", "192.168.1.51"]
},
{
"host": "staging.example.com",
"port": 80,
"ip": ["10.0.0.15"]
},
{
"host": "admin.example.com",
"port": 8443,
"ip": ["172.16.0.10"]
}
]
},
"failed_stopped": null
}
```
**Root Fields:**
* `type` — Always `"finished"` for this event
* `message` — Human-readable status message
* `enumeration_name` — Name of the enumeration configuration
* `enumeration_id` — Unique identifier for this enumeration execution
**Finished Object:**
* `finished_at` — ISO 8601 timestamp when enumeration completed
* `enumeration_time` — Total duration in seconds (e.g., "1800s")
* `total_assets` — Total number of assets in inventory (integer)
* `new_assets` — Number of newly discovered assets (integer)
* `new_assets_list` — Details of newly discovered assets (array)
* `host` — Hostname or domain name
* `port` — Port number
* `ip` — List of IP addresses associated with the host (array of strings)
**Trigger:** When discovery fails or is manually stopped
**Type:** `failed_stopped`
```json Enumeration Failed Payload theme={null}
{
"type": "failed_stopped",
"message": "Enumeration failed due to error",
"enumeration_name": "Weekly Asset Discovery",
"enumeration_id": "enum-xyz789",
"running": null,
"finished": null,
"failed_stopped": {
"timestamp": "2025-11-20T10:15:00Z",
"progress": 45,
"failure_reason": "API rate limit exceeded on cloud provider"
}
}
```
**Root Fields:**
* `type` — Always `"failed_stopped"` for this event
* `message` — Human-readable status message
* `enumeration_name` — Name of the enumeration configuration
* `enumeration_id` — Unique identifier for this enumeration execution
**Failed/Stopped Object:**
* `timestamp` — ISO 8601 timestamp when failure occurred
* `progress` — Completion percentage (0-100) when failed (integer)
* `failure_reason` — Description of why enumeration failed or was stopped (string)
Select an alert event to view its webhook payload structure:
**Trigger:** At the end of a scan when new vulnerabilities are discovered (compared to previous scan)
**Type:** `new_vuln`
**Note:** This event is only triggered for rescans when comparing against previous results
```json New Vulnerability Alert Payload theme={null}
{
"type": "new_vuln",
"message": "New vulnerabilities discovered in scan",
"scan_name": "Production API Security Scan",
"scan_id": "scan-abc123",
"running": null,
"finished": {
"finished_at": "2025-11-20T15:45:00Z",
"scan_time": "4500s",
"total_matches": 23,
"severity_breakdown": {
"critical": 5,
"high": 8,
"medium": 6,
"low": 3,
"info": 1
},
"rescan_new_vulnerabilities": 3,
"rescan_vulns_list": [
{
"Name": "Apache HTTP Server 2.4.49 - Path Traversal",
"Severity": "critical",
"Count": 2
},
{
"Name": "SQL Injection in /api/login",
"Severity": "high",
"Count": 1
}
]
},
"failed_stopped": null
}
```
**Root Fields:**
* `type` — Always `"new_vuln"` for this event
* `message` — Human-readable status message
* `scan_name` — Name of the scan configuration
* `scan_id` — Unique identifier for this scan execution
**Finished Object:**
* `finished_at` — ISO 8601 timestamp when scan completed
* `scan_time` — Total duration in seconds (e.g., "4500s")
* `total_matches` — Total vulnerabilities found in this scan (integer)
* `severity_breakdown` — Count by severity level for all findings (object)
* `rescan_new_vulnerabilities` — **Number of NEW vulnerabilities** compared to previous scan (integer)
* `rescan_vulns_list` — **List of NEW vulnerabilities only**, max 15 items (array)
* `Name` — Vulnerability name/title
* `Severity` — Severity level (critical, high, medium, low, info)
* `Count` — Number of instances found
**Key Difference from "Scan Finished":** This event focuses on `rescan_new_vulnerabilities` - only NEW findings are highlighted. Use this to trigger immediate alerts for emerging threats in your infrastructure.
If you configured severity filters (e.g., only Critical and High), only new vulnerabilities matching those severities will trigger this event and be included in the `rescan_vulns_list`.
**Trigger:** At the end of discovery when new assets are discovered
**Type:** `new_asset`
**Configuration:** Can be enabled for disocvery, scan, or both based on your alerting configuration
```json New Asset Alert Payload theme={null}
{
"type": "new_asset",
"message": "New assets discovered in enumeration",
"enumeration_name": "Weekly Asset Discovery",
"enumeration_id": "enum-xyz789",
"running": null,
"finished": {
"finished_at": "2025-11-20T10:30:00Z",
"enumeration_time": "1800s",
"total_assets": 247,
"new_assets": 5,
"new_assets_list": [
{
"host": "api-v2.example.com",
"port": 443,
"ip": ["192.168.1.50", "192.168.1.51"]
},
{
"host": "staging.example.com",
"port": 80,
"ip": ["10.0.0.15"]
},
{
"host": "admin.example.com",
"port": 8443,
"ip": ["172.16.0.10"]
},
{
"host": "dev.example.com",
"port": 443,
"ip": ["10.0.0.25"]
},
{
"host": "backup.example.com",
"port": 22,
"ip": ["172.16.0.99"]
}
]
},
"failed_stopped": null
}
```
**Root Fields:**
* `type` — Always `"new_asset"` for this event
* `message` — Human-readable status message
* `enumeration_name` — Name of the enumeration configuration
* `enumeration_id` — Unique identifier for this enumeration execution
**Finished Object:**
* `finished_at` — ISO 8601 timestamp when enumeration completed
* `enumeration_time` — Total duration in seconds (e.g., "1800s")
* `total_assets` — Total number of assets in your inventory (integer)
* `new_assets` — **Number of NEWLY discovered assets** (integer)
* `new_assets_list` — **List of NEWLY discovered assets only** (array)
* `host` — Hostname or domain name
* `port` — Port number
* `ip` — List of IP addresses associated with the host (array of strings)
**Key Difference from "Enumeration Finished":** This event focuses on `new_assets` - only NEW discoveries are highlighted. Use this to monitor your attack surface expansion and catch shadow IT or infrastructure changes immediately.
## Ticketing Integrations
The integrations under Ticketing support ticketing functionality as part of scanning and include support for Jira, GitHub, GitLab, and Linear. Navigate to [Scans → Configurations → Ticketing](https://cloud.projectdiscovery.io/scans/configs?type=reporting) to configure your ticketing tools.
### Slack
ProjectDiscovery supports scan notifications through Slack. To enable Slack notifications provide a name for your Configuration, a webhook, and an optional username.
Choose from the list of **Events** (Scan Started, Scan Finished, Scan Failed) to specify what notifications are generated. All Events are selected by default
* Refer to Slack's [documentation on creating webhooks](https://api.slack.com/messaging/webhooks) for configuration details.
### MS Teams
ProjectDiscovery supports notifications through Microsoft Teams. To enable notifications, provide a name for your Configuration and a corresponding webhook.
Choose from the list of **Events** (Scan Started, Scan Finished, Scan Failed) to specify what notifications are generated.
* Refer to [Microsoft's documentation on creating webhooks](https://learn.microsoft.com/en-us/microsoftteams/platform/webhooks-and-connectors/how-to/add-incoming-webhook?tabs=newteams%2Cdotnet) for configuration details.
### Email
ProjectDiscovery supports notifications via Email. To enable email notifications for completed scans simply add your recipient email addresses.
### Webhook
ProjectDiscovery supports custom webhook notifications, allowing you to post events to any HTTP endpoint that matches your infrastructure requirements.
**Quick Setup**
1. Navigate to [Scans → Configurations → Alerting](https://cloud.projectdiscovery.io/scans/configs)
2. Select "Webhook" integration
3. Provide your endpoint URL and optional authentication
4. Choose which events to receive (New Asset, New Vulnerability, Scan/Asset Finished/Failed)
5. Select severity filters (optional)
**Configuration Requirements:**
A descriptive name for your webhook configuration
Your HTTPS endpoint that will receive POST requests
Example: `https://your-domain.com/api/security/alerts`
#### Event Types Overview
ProjectDiscovery sends webhook notifications as **HTTP POST requests** with `Content-Type: application/json`. Each scan or enumeration job triggers multiple webhooks throughout its lifecycle.
Track vulnerability scan lifecycle from start to completion
Started (`running`)
Finished (`finished`)
Failed (`failed_stopped`)
Monitor asset discovery operations in real-time
Started (`running`)
Finished (`finished`)
Failed (`failed_stopped`)
Alerts when new vulnerabilities are found (rescans only)
Type: `new_vuln`
Triggered at end of scan when comparing results
Alerts when new assets are discovered in your attack surface
Type: `new_asset`
Triggered at end of disocvery or scan
**Event Filtering:** Configure which events and severity levels trigger webhooks in your integration settings. This helps reduce noise and focus on what matters most to your team.
**Scan and Discovery lifecycle events** trigger **3 separate webhook calls**: one when it starts (`running`), one when it completes (`finished` or `failed_stopped`). Only the relevant data object is populated in each webhook - the others will be `null`.
**New Vulnerability and New Asset alerts** are single webhooks sent only when new items are discovered (at the end of scan/enumeration).
***
#### Webhook Payload Reference
Select a scan event to view its webhook payload structure:
**Trigger:** Immediately when a vulnerability scan begins execution
**Type:** `running`
```json Scan Started Payload theme={null}
{
"type": "running",
"message": "Scan started successfully",
"scan_name": "Production API Security Scan",
"scan_id": "scan-abc123",
"running": {
"started_at": "2025-11-20T14:30:00Z",
"total_targets": 150,
"total_templates": 85,
"total_requests": 12750
},
"finished": null,
"failed_stopped": null
}
```
**Root Fields:**
* `type` — Always `"running"` for this event
* `message` — Human-readable status message
* `scan_name` — Name of the scan configuration
* `scan_id` — Unique identifier for this scan execution
**Running Object:**
* `started_at` — ISO 8601 timestamp when scan started
* `total_targets` — Number of targets to scan (integer)
* `total_templates` — Number of templates being used (integer)
* `total_requests` — Estimated total HTTP requests (integer)
**Trigger:** When a vulnerability scan completes successfully
**Type:** `finished`
```json Scan Finished Payload theme={null}
{
"type": "finished",
"message": "Scan completed successfully",
"scan_name": "Production API Security Scan",
"scan_id": "scan-abc123",
"running": null,
"finished": {
"finished_at": "2025-11-20T15:45:00Z",
"scan_time": "4500s",
"total_matches": 23,
"severity_breakdown": {
"critical": 5,
"high": 8,
"medium": 6,
"low": 3,
"info": 1
},
"rescan_new_vulnerabilities": 3,
"rescan_vulns_list": [
{
"Name": "Apache HTTP Server 2.4.49 - Path Traversal",
"Severity": "critical",
"Count": 2
},
{
"Name": "SQL Injection in /api/login",
"Severity": "high",
"Count": 1
}
]
},
"failed_stopped": null
}
```
**Root Fields:**
* `type` — Always `"finished"` for this event
* `message` — Human-readable status message
* `scan_name` — Name of the scan configuration
* `scan_id` — Unique identifier for this scan execution
**Finished Object:**
* `finished_at` — ISO 8601 timestamp when scan completed
* `scan_time` — Total duration in seconds (e.g., "4500s")
* `total_matches` — Total vulnerabilities found (integer)
* `severity_breakdown` — Count by severity level (object)
* `critical` — Critical severity count
* `high` — High severity count
* `medium` — Medium severity count
* `low` — Low severity count
* `info` — Info severity count
* `rescan_new_vulnerabilities` — New vulns since last scan, rescans only (integer)
* `rescan_vulns_list` — List of new vulnerabilities, **max 15 items**, rescans only (array)
* `Name` — Vulnerability name/title
* `Severity` — Severity level (critical, high, medium, low, info)
* `Count` — Number of instances found
**Truncation:** The `rescan_vulns_list` is limited to **15 items** for webhook delivery. For the complete vulnerability list, fetch full scan results via the API.
**Severity Filtering:** If you configured severity filters in webhook settings, only matching vulnerabilities will be included in counts and lists.
**Trigger:** When a scan fails or is manually stopped
**Type:** `failed_stopped`
```json Scan Failed Payload theme={null}
{
"type": "failed_stopped",
"message": "Scan failed due to error",
"scan_name": "Production API Security Scan",
"scan_id": "scan-abc123",
"running": null,
"finished": null,
"failed_stopped": {
"timestamp": "2025-11-20T15:20:00Z",
"progress": 67,
"failure_reason": "Network timeout connecting to target hosts"
}
}
```
**Root Fields:**
* `type` — Always `"failed_stopped"` for this event
* `message` — Human-readable status message
* `scan_name` — Name of the scan configuration
* `scan_id` — Unique identifier for this scan execution
**Failed/Stopped Object:**
* `timestamp` — ISO 8601 timestamp when failure occurred
* `progress` — Completion percentage (0-100) when failed (integer)
* `failure_reason` — Description of why scan failed or was stopped (string)
Select an Discovery event to view its webhook payload structure:
**Trigger:** When asset discovery begins
**Type:** `running`
```json Enumeration Started Payload theme={null}
{
"type": "running",
"message": "Enumeration started successfully",
"enumeration_name": "Weekly Asset Discovery",
"enumeration_id": "enum-xyz789",
"running": {
"started_at": "2025-11-20T10:00:00Z"
},
"finished": null,
"failed_stopped": null
}
```
**Root Fields:**
* `type` — Always `"running"` for this event
* `message` — Human-readable status message
* `enumeration_name` — Name of the enumeration configuration
* `enumeration_id` — Unique identifier for this enumeration execution
**Running Object:**
* `started_at` — ISO 8601 timestamp when enumeration started
**Trigger:** When asset disocvery completes successfully
**Type:** `finished`
```json Enumeration Finished Payload theme={null}
{
"type": "finished",
"message": "Enumeration completed successfully",
"enumeration_name": "Weekly Asset Discovery",
"enumeration_id": "enum-xyz789",
"running": null,
"finished": {
"finished_at": "2025-11-20T10:30:00Z",
"enumeration_time": "1800s",
"total_assets": 247,
"new_assets": 5,
"new_assets_list": [
{
"host": "api-v2.example.com",
"port": 443,
"ip": ["192.168.1.50", "192.168.1.51"]
},
{
"host": "staging.example.com",
"port": 80,
"ip": ["10.0.0.15"]
},
{
"host": "admin.example.com",
"port": 8443,
"ip": ["172.16.0.10"]
}
]
},
"failed_stopped": null
}
```
**Root Fields:**
* `type` — Always `"finished"` for this event
* `message` — Human-readable status message
* `enumeration_name` — Name of the enumeration configuration
* `enumeration_id` — Unique identifier for this enumeration execution
**Finished Object:**
* `finished_at` — ISO 8601 timestamp when enumeration completed
* `enumeration_time` — Total duration in seconds (e.g., "1800s")
* `total_assets` — Total number of assets in inventory (integer)
* `new_assets` — Number of newly discovered assets (integer)
* `new_assets_list` — Details of newly discovered assets (array)
* `host` — Hostname or domain name
* `port` — Port number
* `ip` — List of IP addresses associated with the host (array of strings)
**Trigger:** When discovery fails or is manually stopped
**Type:** `failed_stopped`
```json Enumeration Failed Payload theme={null}
{
"type": "failed_stopped",
"message": "Enumeration failed due to error",
"enumeration_name": "Weekly Asset Discovery",
"enumeration_id": "enum-xyz789",
"running": null,
"finished": null,
"failed_stopped": {
"timestamp": "2025-11-20T10:15:00Z",
"progress": 45,
"failure_reason": "API rate limit exceeded on cloud provider"
}
}
```
**Root Fields:**
* `type` — Always `"failed_stopped"` for this event
* `message` — Human-readable status message
* `enumeration_name` — Name of the enumeration configuration
* `enumeration_id` — Unique identifier for this enumeration execution
**Failed/Stopped Object:**
* `timestamp` — ISO 8601 timestamp when failure occurred
* `progress` — Completion percentage (0-100) when failed (integer)
* `failure_reason` — Description of why enumeration failed or was stopped (string)
Select an alert event to view its webhook payload structure:
**Trigger:** At the end of a scan when new vulnerabilities are discovered (compared to previous scan)
**Type:** `new_vuln`
**Note:** This event is only triggered for rescans when comparing against previous results
```json New Vulnerability Alert Payload theme={null}
{
"type": "new_vuln",
"message": "New vulnerabilities discovered in scan",
"scan_name": "Production API Security Scan",
"scan_id": "scan-abc123",
"running": null,
"finished": {
"finished_at": "2025-11-20T15:45:00Z",
"scan_time": "4500s",
"total_matches": 23,
"severity_breakdown": {
"critical": 5,
"high": 8,
"medium": 6,
"low": 3,
"info": 1
},
"rescan_new_vulnerabilities": 3,
"rescan_vulns_list": [
{
"Name": "Apache HTTP Server 2.4.49 - Path Traversal",
"Severity": "critical",
"Count": 2
},
{
"Name": "SQL Injection in /api/login",
"Severity": "high",
"Count": 1
}
]
},
"failed_stopped": null
}
```
**Root Fields:**
* `type` — Always `"new_vuln"` for this event
* `message` — Human-readable status message
* `scan_name` — Name of the scan configuration
* `scan_id` — Unique identifier for this scan execution
**Finished Object:**
* `finished_at` — ISO 8601 timestamp when scan completed
* `scan_time` — Total duration in seconds (e.g., "4500s")
* `total_matches` — Total vulnerabilities found in this scan (integer)
* `severity_breakdown` — Count by severity level for all findings (object)
* `rescan_new_vulnerabilities` — **Number of NEW vulnerabilities** compared to previous scan (integer)
* `rescan_vulns_list` — **List of NEW vulnerabilities only**, max 15 items (array)
* `Name` — Vulnerability name/title
* `Severity` — Severity level (critical, high, medium, low, info)
* `Count` — Number of instances found
**Key Difference from "Scan Finished":** This event focuses on `rescan_new_vulnerabilities` - only NEW findings are highlighted. Use this to trigger immediate alerts for emerging threats in your infrastructure.
If you configured severity filters (e.g., only Critical and High), only new vulnerabilities matching those severities will trigger this event and be included in the `rescan_vulns_list`.
**Trigger:** At the end of discovery when new assets are discovered
**Type:** `new_asset`
**Configuration:** Can be enabled for disocvery, scan, or both based on your alerting configuration
```json New Asset Alert Payload theme={null}
{
"type": "new_asset",
"message": "New assets discovered in enumeration",
"enumeration_name": "Weekly Asset Discovery",
"enumeration_id": "enum-xyz789",
"running": null,
"finished": {
"finished_at": "2025-11-20T10:30:00Z",
"enumeration_time": "1800s",
"total_assets": 247,
"new_assets": 5,
"new_assets_list": [
{
"host": "api-v2.example.com",
"port": 443,
"ip": ["192.168.1.50", "192.168.1.51"]
},
{
"host": "staging.example.com",
"port": 80,
"ip": ["10.0.0.15"]
},
{
"host": "admin.example.com",
"port": 8443,
"ip": ["172.16.0.10"]
},
{
"host": "dev.example.com",
"port": 443,
"ip": ["10.0.0.25"]
},
{
"host": "backup.example.com",
"port": 22,
"ip": ["172.16.0.99"]
}
]
},
"failed_stopped": null
}
```
**Root Fields:**
* `type` — Always `"new_asset"` for this event
* `message` — Human-readable status message
* `enumeration_name` — Name of the enumeration configuration
* `enumeration_id` — Unique identifier for this enumeration execution
**Finished Object:**
* `finished_at` — ISO 8601 timestamp when enumeration completed
* `enumeration_time` — Total duration in seconds (e.g., "1800s")
* `total_assets` — Total number of assets in your inventory (integer)
* `new_assets` — **Number of NEWLY discovered assets** (integer)
* `new_assets_list` — **List of NEWLY discovered assets only** (array)
* `host` — Hostname or domain name
* `port` — Port number
* `ip` — List of IP addresses associated with the host (array of strings)
**Key Difference from "Enumeration Finished":** This event focuses on `new_assets` - only NEW discoveries are highlighted. Use this to monitor your attack surface expansion and catch shadow IT or infrastructure changes immediately.
## Ticketing Integrations
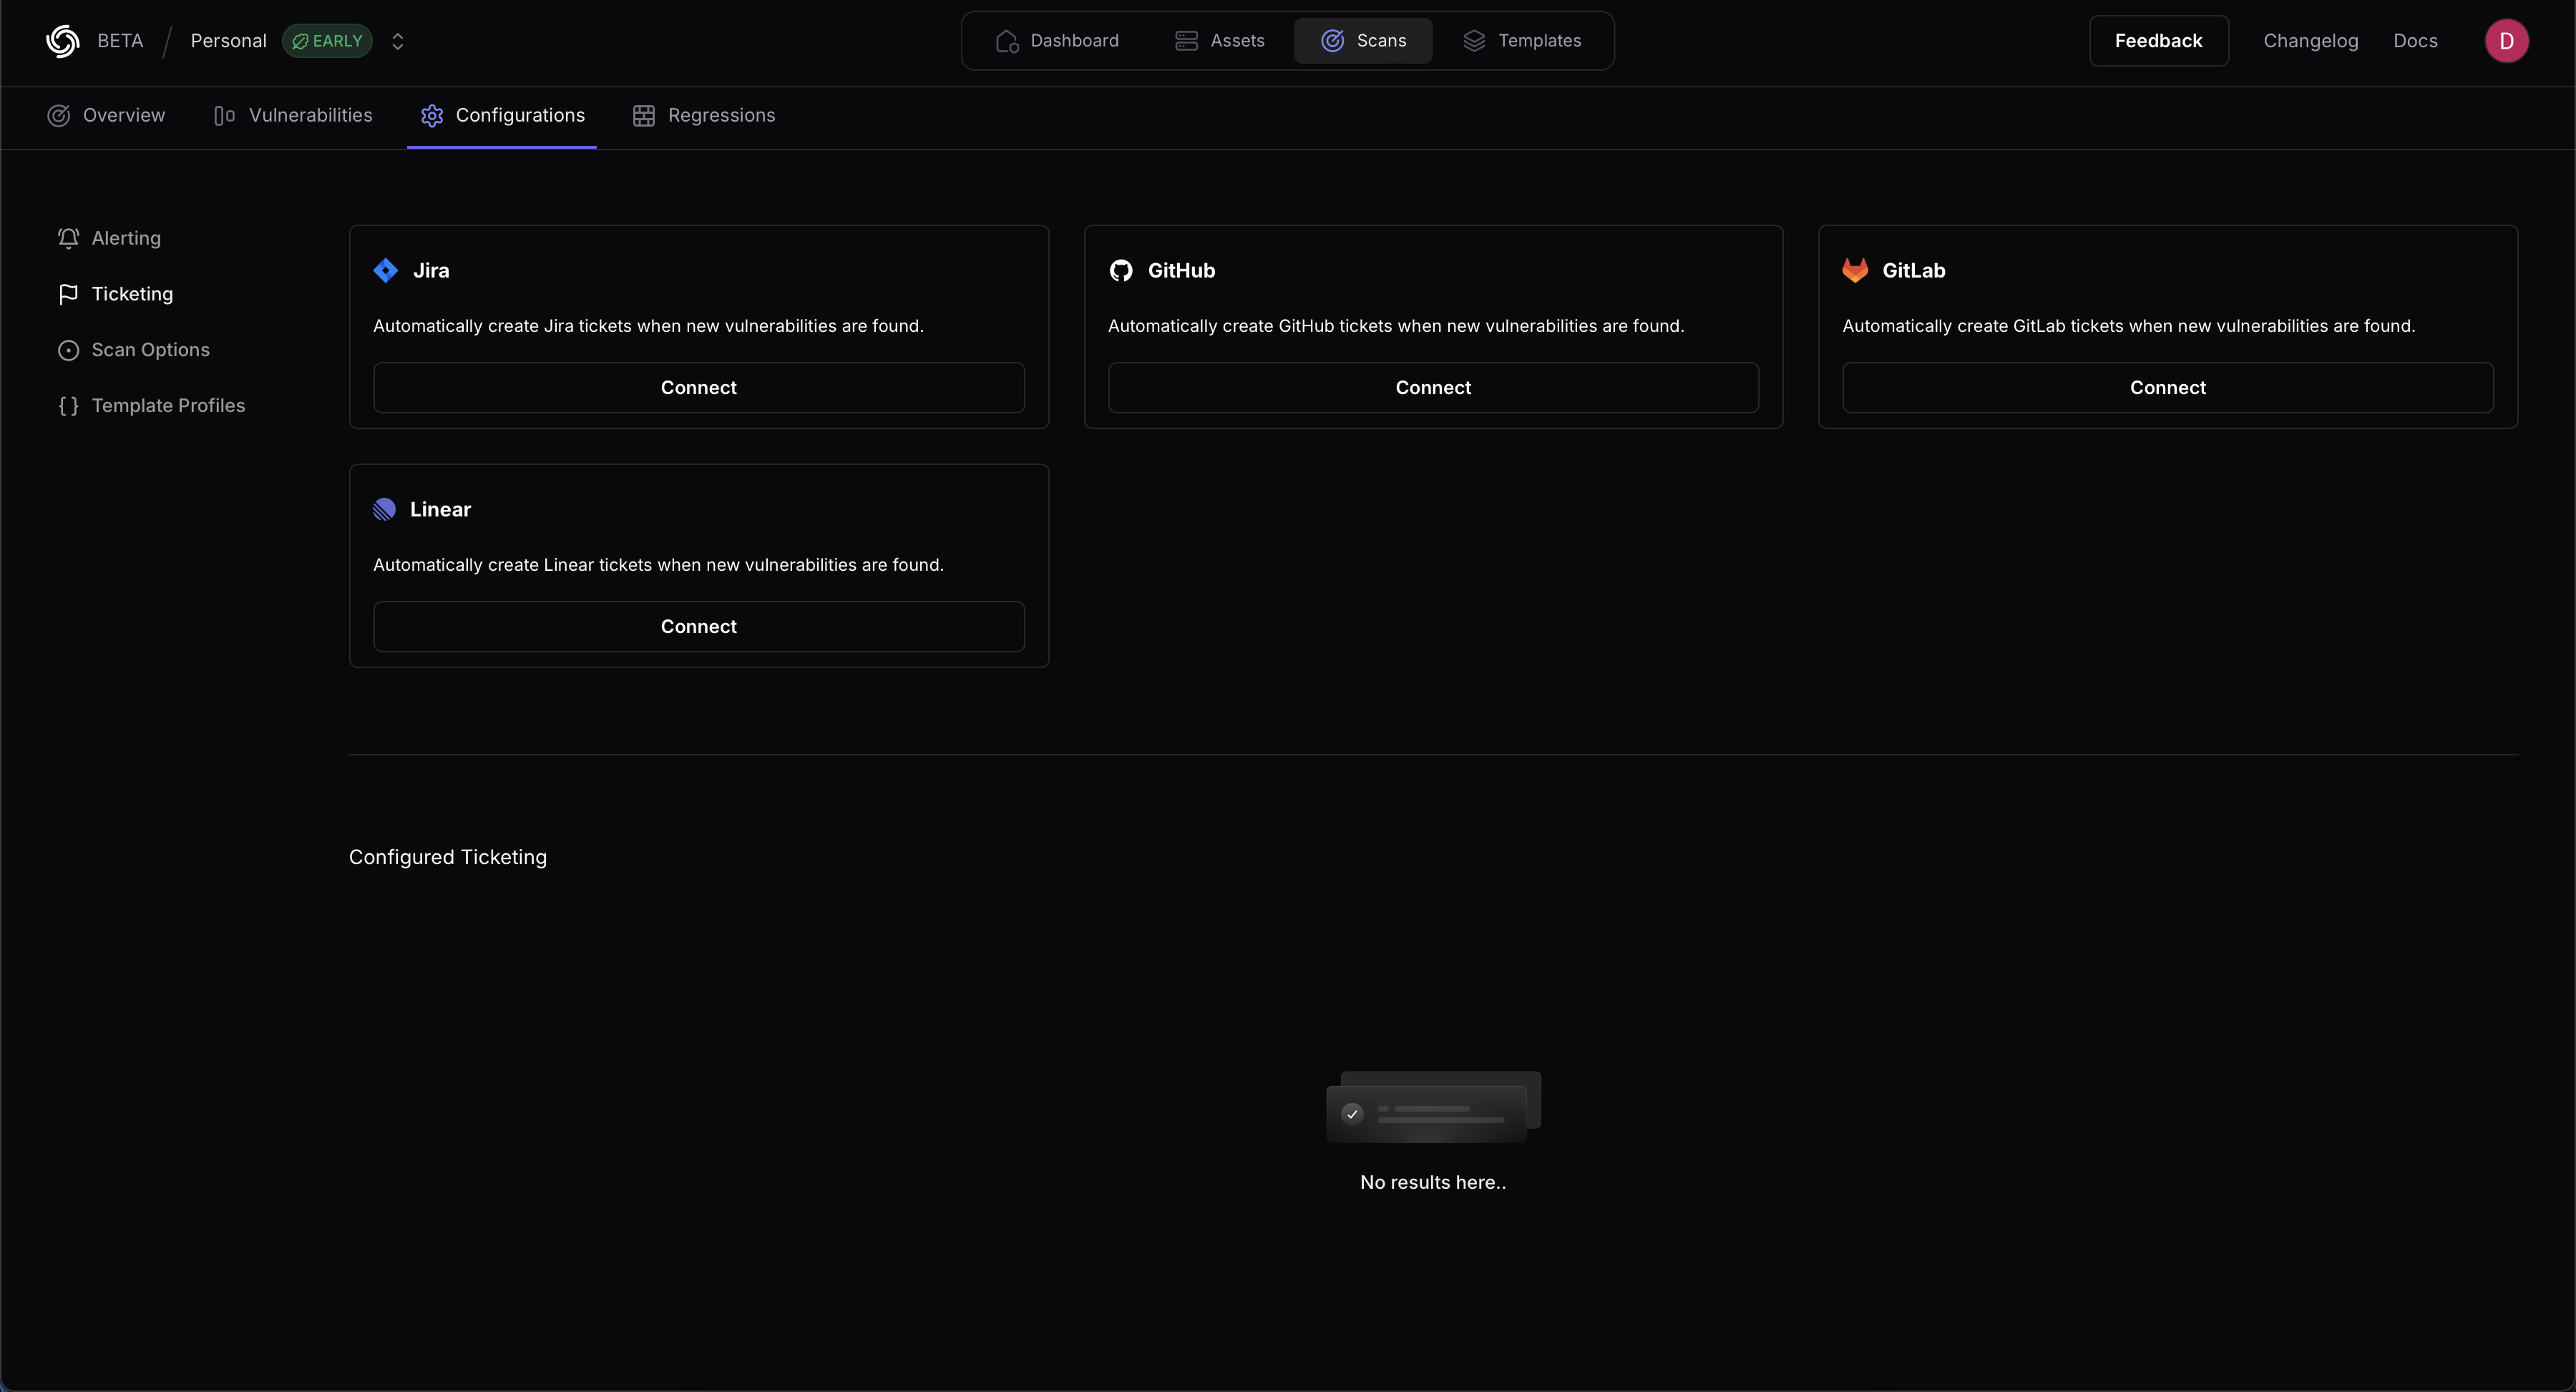
The integrations under Ticketing support ticketing functionality as part of scanning and include support for Jira, GitHub, GitLab, and Linear. Navigate to [Scans → Configurations → Ticketing](https://cloud.projectdiscovery.io/scans/configs?type=reporting) to configure your ticketing tools.
 ### Jira
ProjectDiscovery provides integration support for Jira to create new tickets when vulnerabilities are found.
Provide a name for the configuration, the Jira instance URL , the Account ID, the Email, and the associated API token.
Details on creating an API token are available [in the Jira documentation here.](https://support.atlassian.com/atlassian-account/docs/manage-api-tokens-for-your-atlassian-account/)
### GitHub
ProjectDiscovery provides integration support for GitHub to create new tickets when vulnerabilities are found.
Provide a name for the configuration, the Organization or username, Project name, Issue Assignee, Token, and Issue Label. The Issue Label determines when a ticket is created. (For example, if critical severity is selected, any issues with a critical severity will create a ticket.)
* The severity as label option adds a template result severity to any GitHub issues created.
* Deduplicate posts any new results as comments on existing issues instead of creating new issues for the same result.
Details on setting up access in GitHub [are available here.](https://docs.github.com/en/authentication/keeping-your-account-and-data-secure/managing-your-personal-access-tokens)
### GitLab
ProjectDiscovery provides integration support for GitLab to create new tickets when vulnerabilities are found.
Provide your GitLab username, Project name, Project Access Token and a GitLab Issue label. The Issue Label determines when a ticket is created.
(For example, if critical severity is selected, any issues with a critical severity will create a ticket.)
* The severity as label option adds a template result severity to any GitLab issues created.
* Deduplicate posts any new results as comments on existing issues instead of creating new issues for the same result.
Refer to GitLab's documentation for details on [configuring a Project Access token.](https://docs.gitlab.com/ee/user/project/settings/project_access_tokens.html#create-a-project-access-token)
### Linear
ProjectDiscovery integrates with Linear for automated issue tracking. The integration requires the following API parameters:
1. Linear API Key
2. Linear Team ID
3. Linear Open State ID
To retrieve these parameters:
1. **API Key Generation**:
* Path: Linear > Settings > API > Personal API keys
* Direct URL: linear.app/\[workspace]/settings/api
2. **Team ID Retrieval**:
```graphql theme={null}
query {
teams {
nodes {
id
name
}
}
}
```
1. **Open State ID Retrieval**:
```graphql theme={null}
query {
workflowStates {
nodes {
id
name
}
}
}
```
For detailed API documentation, refer to the [Linear API Documentation](https://developers.linear.app/docs/graphql/working-with-the-graphql-api).
## Cloud Asset Discovery
ProjectDiscovery supports integrations with all popular cloud providers to automatically sync externally facing hosts for vulnerability scanning. This comprehensive approach ensures all your cloud resources with external exposure are continuously monitored, complementing our external discovery capabilities. The result is complete visibility of your attack surface across cloud environments through a simple web interface.
### AWS (Amazon Web Services)
Click here to open the AWS integration configuration page in the ProjectDiscovery Cloud platform
ProjectDiscovery's AWS integration allows the platform to automatically discover and monitor cloud assets across your AWS accounts. By connecting AWS to ProjectDiscovery, security teams and DevOps engineers gain continuous visibility into EC2 instances, S3 buckets, DNS records, and other resources without manual inventory. This integration leverages ProjectDiscovery's open-source **Cloudlist** engine to enumerate assets via AWS APIs. In short, it helps ensure no cloud asset goes unnoticed, enabling proactive security monitoring and easier management of your attack surface.
### Jira
ProjectDiscovery provides integration support for Jira to create new tickets when vulnerabilities are found.
Provide a name for the configuration, the Jira instance URL , the Account ID, the Email, and the associated API token.
Details on creating an API token are available [in the Jira documentation here.](https://support.atlassian.com/atlassian-account/docs/manage-api-tokens-for-your-atlassian-account/)
### GitHub
ProjectDiscovery provides integration support for GitHub to create new tickets when vulnerabilities are found.
Provide a name for the configuration, the Organization or username, Project name, Issue Assignee, Token, and Issue Label. The Issue Label determines when a ticket is created. (For example, if critical severity is selected, any issues with a critical severity will create a ticket.)
* The severity as label option adds a template result severity to any GitHub issues created.
* Deduplicate posts any new results as comments on existing issues instead of creating new issues for the same result.
Details on setting up access in GitHub [are available here.](https://docs.github.com/en/authentication/keeping-your-account-and-data-secure/managing-your-personal-access-tokens)
### GitLab
ProjectDiscovery provides integration support for GitLab to create new tickets when vulnerabilities are found.
Provide your GitLab username, Project name, Project Access Token and a GitLab Issue label. The Issue Label determines when a ticket is created.
(For example, if critical severity is selected, any issues with a critical severity will create a ticket.)
* The severity as label option adds a template result severity to any GitLab issues created.
* Deduplicate posts any new results as comments on existing issues instead of creating new issues for the same result.
Refer to GitLab's documentation for details on [configuring a Project Access token.](https://docs.gitlab.com/ee/user/project/settings/project_access_tokens.html#create-a-project-access-token)
### Linear
ProjectDiscovery integrates with Linear for automated issue tracking. The integration requires the following API parameters:
1. Linear API Key
2. Linear Team ID
3. Linear Open State ID
To retrieve these parameters:
1. **API Key Generation**:
* Path: Linear > Settings > API > Personal API keys
* Direct URL: linear.app/\[workspace]/settings/api
2. **Team ID Retrieval**:
```graphql theme={null}
query {
teams {
nodes {
id
name
}
}
}
```
1. **Open State ID Retrieval**:
```graphql theme={null}
query {
workflowStates {
nodes {
id
name
}
}
}
```
For detailed API documentation, refer to the [Linear API Documentation](https://developers.linear.app/docs/graphql/working-with-the-graphql-api).
## Cloud Asset Discovery
ProjectDiscovery supports integrations with all popular cloud providers to automatically sync externally facing hosts for vulnerability scanning. This comprehensive approach ensures all your cloud resources with external exposure are continuously monitored, complementing our external discovery capabilities. The result is complete visibility of your attack surface across cloud environments through a simple web interface.
### AWS (Amazon Web Services)
Click here to open the AWS integration configuration page in the ProjectDiscovery Cloud platform
ProjectDiscovery's AWS integration allows the platform to automatically discover and monitor cloud assets across your AWS accounts. By connecting AWS to ProjectDiscovery, security teams and DevOps engineers gain continuous visibility into EC2 instances, S3 buckets, DNS records, and other resources without manual inventory. This integration leverages ProjectDiscovery's open-source **Cloudlist** engine to enumerate assets via AWS APIs. In short, it helps ensure no cloud asset goes unnoticed, enabling proactive security monitoring and easier management of your attack surface.
 Supported AWS Services:
| Service | Description |
| :---------------------------------------------------- | :-------------------------------------------- |
| [EC2](https://aws.amazon.com/ec2/) | VM instances and their public IPs |
| [Route53](https://aws.amazon.com/route53/) | DNS hosted zones and records |
| [S3](https://aws.amazon.com/s3/) | Buckets (especially those public or with DNS) |
| [Cloudfront](https://aws.amazon.com/cloudfront/) | CDN distributions and their domains |
| [ECS](https://aws.amazon.com/ecs/) | Container cluster resources |
| [EKS](https://aws.amazon.com/eks/) | Kubernetes cluster endpoints |
| [ELB](https://aws.amazon.com/elasticloadbalancing/) | Load balancers (Classic ELB and ALB/NLB) |
| [ELBv2](https://aws.amazon.com/elasticloadbalancing/) | Load balancers (Classic ELB and ALB/NLB) |
| [Lambda](https://aws.amazon.com/lambda/) | Serverless function endpoints |
| [Lightsail](https://aws.amazon.com/lightsail/) | Lightsail instances (simplified VPS) |
| [Apigateway](https://aws.amazon.com/api-gateway/) | API endpoints deployed via Amazon API Gateway |
By covering these services, ProjectDiscovery can map out a broad range of AWS assets in your account. (Support for additional services may be added over time.)
**AWS Integration Methods**
ProjectDiscovery supports three methods to connect to AWS, each suited for different use cases and security preferences:
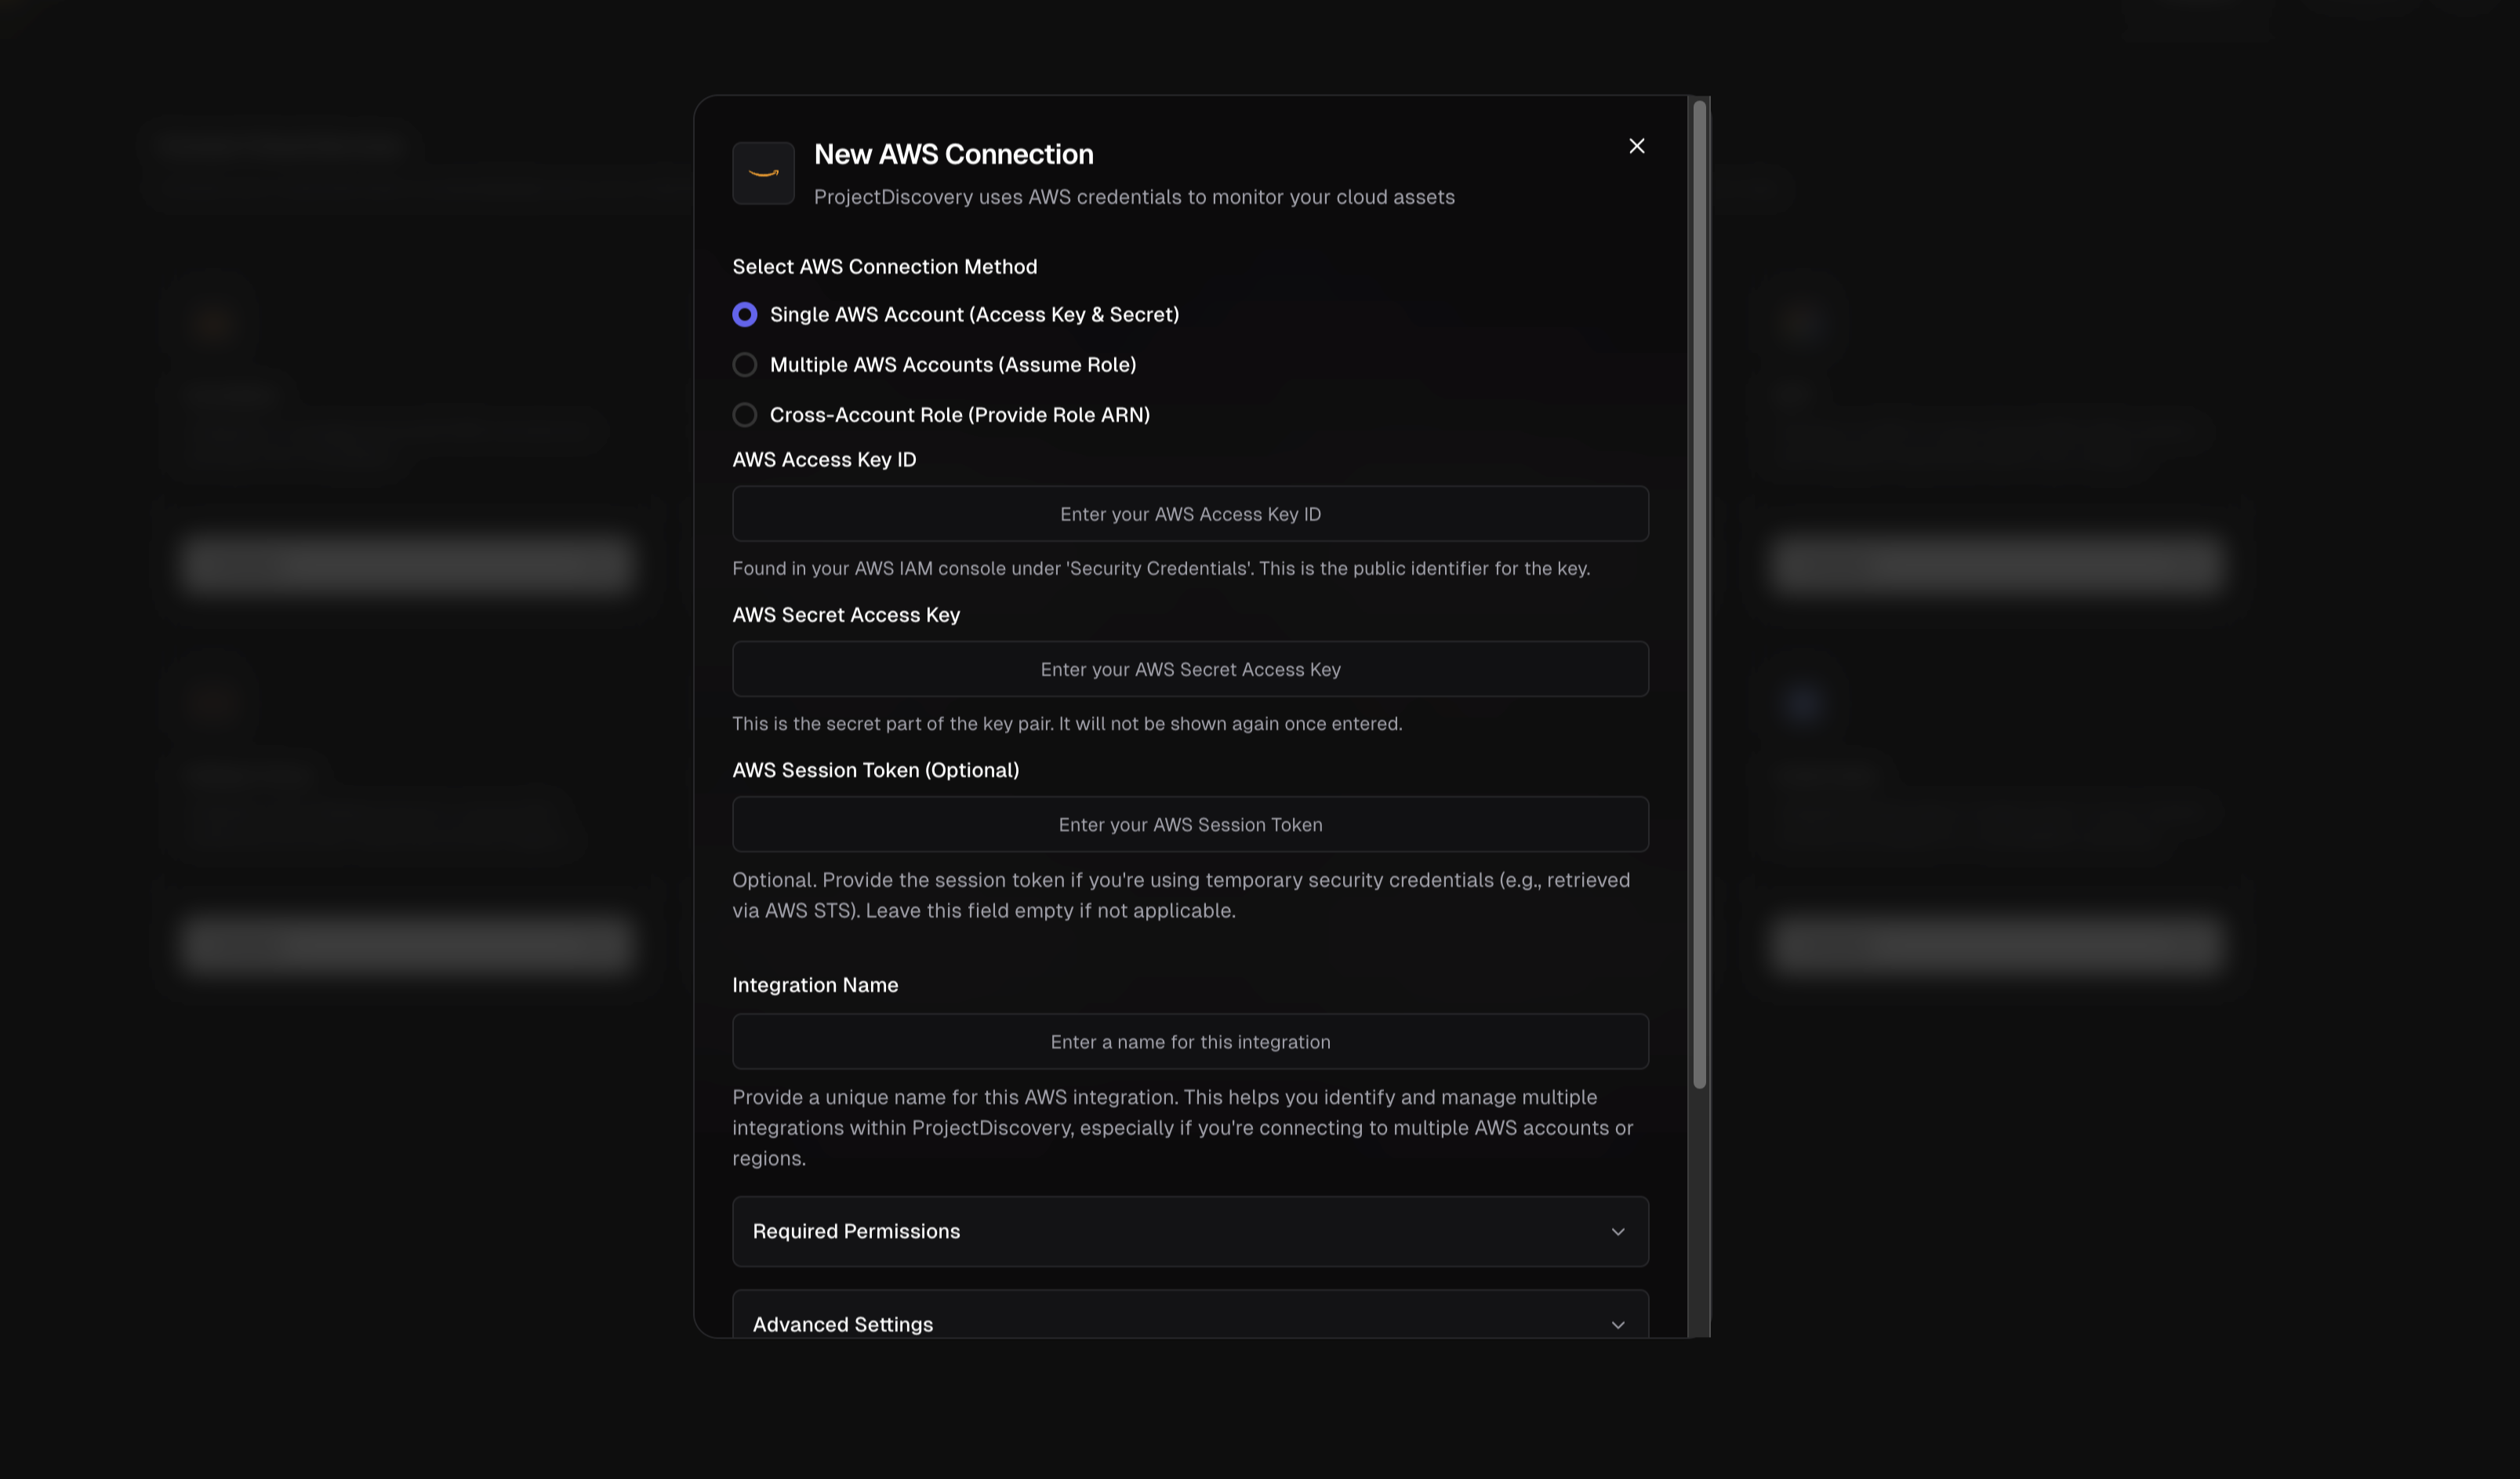
1. **Single AWS Account (Access Key & Secret)** – Direct credential-based authentication using an IAM User's Access Key ID and Secret Access Key to connect one AWS account. Choose this for quick setups or single-account monitoring.
2. **Multiple AWS Accounts (Assume Role)** – Use one set of credentials to assume roles in multiple accounts. This method is ideal for organizations with multiple AWS accounts (e.g. dev, prod, etc.). You provide one account's credentials and the common role name that exists in all target accounts.
3. **Cross-Account Role (Role ARN)** – Use a dedicated IAM role with an External ID for third-party access. This option lets you create a cross-account IAM role in your AWS account and grant ProjectDiscovery access via that role's Amazon Resource Name (ARN). This is the most secure integration method, as it follows AWS best practices for third-party account access.
**Prerequisites**
Before configuring the integration, make sure you have:
* **AWS Account** – Access to an AWS account where you can create IAM identities
* **Admin Access to IAM** – Permissions to create IAM users and roles
* **ProjectDiscovery Account** – Access to ProjectDiscovery's Cloud platform
* **Basic AWS IAM Knowledge** – Understanding of IAM users, access keys, and roles
#### 1. Single AWS Account (Access Key & Secret)
To connect a single AWS account directly:
1. **Create a Read-Only IAM User:** In the AWS IAM console, create a new IAM user for ProjectDiscovery integration. Assign **programmatic access** (which generates an Access Key ID and Secret Access Key).
2. **Attach Required Policies:** Grant the user read-only permissions to the AWS services you want to monitor. You can use AWS-managed policies like **AmazonEC2ReadOnlyAccess**, **AmazonS3ReadOnlyAccess**, etc. for each service (see the **Required Permissions** section below).
3. **Configure in ProjectDiscovery:**
* Select **Single AWS Account (Access Key & Secret)**
* Enter your **AWS Access Key ID** and **AWS Secret Access Key**
* Optionally provide a **Session Token** (only for temporary credentials)
* Give the integration a unique name
* Select the AWS services you want to monitor
*Tip:* Use an IAM user with minimal read-only permissions and rotate keys periodically for security.
#### 2. Multiple AWS Accounts (Assume Role)
For monitoring multiple AWS accounts from a central account:
1. **Choose a Primary Account:** Create an IAM user in one AWS account (the "primary") with programmatic access.
2. **Create an IAM Role in Each Target Account:** In each AWS account you want to monitor, create a role that:
* Uses the **same role name** across all accounts (e.g., "ProjectDiscoveryReadOnlyRole")
* Has a trust relationship allowing your primary account to assume it
* Has the required read-only permissions
3. **Configure in ProjectDiscovery:**
* Select **Multiple AWS Accounts (Assume Role)**
* Enter the primary account's **AWS Access Key ID** and **Secret Access Key**
* Specify the **Role Name to Assume** (the common role name)
* List all **AWS Account IDs** to monitor (one per line)
* Give the integration a unique name
* Select the AWS services you want to monitor
#### 3. Cross-Account Role (Role ARN)
The most secure method using ProjectDiscovery's service account:
1. **Create an IAM Role in Your AWS Account:**
* In your AWS console, go to IAM → Roles → Create Role
* Select "Another AWS account" as the trusted entity
* Enter ProjectDiscovery's ARN: `arn:aws:iam::034362060511:user/projectdiscovery`
* Enable "Require External ID" and enter the External ID shown in the ProjectDiscovery UI
* Attach the necessary read-only permissions
2. **Configure in ProjectDiscovery:**
* Select **Cross-Account Role (Role ARN)**
* Enter the **Role ARN** of the role you created
* Give the integration a unique name
* Select the AWS services you want to monitor
**Required Permissions**
ProjectDiscovery needs read-only access to your AWS assets. The following AWS-managed policies are recommended:
* EC2 - AmazonEC2ReadOnlyAccess
* Route53 - AmazonRoute53ReadOnlyAccess
* S3 - AmazonS3ReadOnlyAccess
* Lambda - AWSLambda\_ReadOnlyAccess
* ELB - ElasticLoadBalancingReadOnly
* Cloudfront - CloudFrontReadOnlyAccess
Alternatively, you can use this custom policy for minimal permissions:
```json theme={null}
{
"Version": "2012-10-17",
"Statement": [
{
"Sid": "RequiredReadPermissions",
"Effect": "Allow",
"Action": [
"ec2:DescribeInstances",
"ec2:DescribeRegions",
"route53:ListHostedZones",
"route53:ListResourceRecordSets",
"s3:ListAllMyBuckets",
"lambda:ListFunctions",
"elasticloadbalancing:DescribeLoadBalancers",
"elasticloadbalancing:DescribeTargetGroups",
"elasticloadbalancing:DescribeTargetHealth",
"cloudfront:ListDistributions",
"ecs:ListClusters",
"ecs:ListServices",
"ecs:ListTasks",
"ecs:DescribeTasks",
"ecs:DescribeContainerInstances",
"eks:ListClusters",
"eks:DescribeCluster",
"apigateway:GET",
"lightsail:GetInstances",
"lightsail:GetRegions"
],
"Resource": "*"
}
]
}
```
**Verifying the Integration**
After configuring the integration, it's important to verify that ProjectDiscovery is successfully connected and enumerating your AWS assets:
* **Check Asset Discovery:** In the ProjectDiscovery platform, navigate to the cloud assets or inventory section. After a successful integration, you should start seeing resources from your AWS account(s) listed (for example, EC2 instance IDs, S3 bucket names, etc., corresponding to the integrated accounts). It may take a short while for the initial discovery to complete. If you see those assets, the integration is working.
* **Test with a Known Resource:** As a quick test, pick a known resource (like a specific EC2 instance or S3 bucket in your AWS account) and search for it in ProjectDiscovery's asset inventory. If it appears, the connection is functioning and pulling data.
* **Troubleshooting Errors:** If the integration fails or some assets are missing, consider these common issues:
* *Incorrect Credentials:* Double-check that the Access Key and Secret (if used) were entered correctly and correspond to an active IAM user. If you recently created the user, ensure you copied the keys exactly (no extra spaces or missing characters).
* *Insufficient Permissions:* If certain services aren't showing up, the IAM policy might be missing permissions. For example, if S3 buckets aren't listed, confirm that the policy includes `s3:ListAllMyBuckets`. Refer back to the Required Permissions and make sure all relevant actions are allowed. You can also use AWS IAM Policy Simulator or CloudTrail logs to see if any **AccessDenied** errors occur when ProjectDiscovery calls AWS APIs.
* *Assume Role Failures:* In multi-account or cross-account setups, a common issue is a misconfigured trust relationship. If ProjectDiscovery cannot assume a role, you might see an error in the UI or logs like "AccessDenied: Not authorized to perform sts:AssumeRole". In that case, check the following:
* The trust policy of the IAM role (in target account) trusts the correct principal (either your primary account's IAM user/role ARN for multi-account, or ProjectDiscovery's external account ID for cross-account) and the External ID if applicable.
* The role name or ARN in the ProjectDiscovery config exactly matches the one in AWS (spelling/case must match).
* The primary credentials (for multi-account) have permission to call `AssumeRole`.
* *External ID Mismatch:* For cross-account roles, if the external ID in ProjectDiscovery and the one in the IAM role's trust policy do not match, AWS will deny the assume request. Ensure you didn't accidentally copy the wrong value or include extra spaces. It must be exact.
* **AWS CloudTrail Logs:** As an additional verification, you can check AWS CloudTrail in your account. When ProjectDiscovery connects, you should see events like `DescribeInstances`, `ListBuckets`, etc., being called by the IAM user or assumed role. For cross-account roles, you will see an `AssumeRole` event from ProjectDiscovery's AWS account ID, and subsequent calls under the assumed role's identity. This audit trail can confirm that the integration is working as intended and using only allowed actions.
If all checks out, ProjectDiscovery is now actively monitoring your AWS environment. New resources launched in AWS should be detected on the next scan cycle, and any changes to your cloud footprint will be reflected in the platform. Make sure to regularly review the integration and update the IAM permissions if you start using new AWS services.
**References:**
1. [https://docs.aws.amazon.com/IAM/latest/UserGuide/reference\_policies\_examples\_iam\_read-only-console.html](https://docs.aws.amazon.com/IAM/latest/UserGuide/reference_policies_examples_iam_read-only-console.html)
2. [https://docs.aws.amazon.com/IAM/latest/UserGuide/id\_credentials\_access-keys.html](https://docs.aws.amazon.com/IAM/latest/UserGuide/id_credentials_access-keys.html)
3. [https://docs.aws.amazon.com/IAM/latest/UserGuide/id\_credentials\_temp\_request.html](https://docs.aws.amazon.com/IAM/latest/UserGuide/id_credentials_temp_request.html)
4. [https://docs.aws.amazon.com/sdkref/latest/guide/feature-assume-role-credentials.html](https://docs.aws.amazon.com/sdkref/latest/guide/feature-assume-role-credentials.html)
5. [https://docs.logrhythm.com/OCbeats/docs/aws-cross-account-access-using-sts-assume-role](https://docs.logrhythm.com/OCbeats/docs/aws-cross-account-access-using-sts-assume-role)
### Google Cloud Platform (GCP)
Click here to open the GCP integration configuration page in the ProjectDiscovery Cloud platform
ProjectDiscovery's GCP integration allows the platform to automatically discover and monitor cloud assets across your GCP account. The integration supports **two discovery approaches** to accommodate different organizational structures and permission models.
Supported AWS Services:
| Service | Description |
| :---------------------------------------------------- | :-------------------------------------------- |
| [EC2](https://aws.amazon.com/ec2/) | VM instances and their public IPs |
| [Route53](https://aws.amazon.com/route53/) | DNS hosted zones and records |
| [S3](https://aws.amazon.com/s3/) | Buckets (especially those public or with DNS) |
| [Cloudfront](https://aws.amazon.com/cloudfront/) | CDN distributions and their domains |
| [ECS](https://aws.amazon.com/ecs/) | Container cluster resources |
| [EKS](https://aws.amazon.com/eks/) | Kubernetes cluster endpoints |
| [ELB](https://aws.amazon.com/elasticloadbalancing/) | Load balancers (Classic ELB and ALB/NLB) |
| [ELBv2](https://aws.amazon.com/elasticloadbalancing/) | Load balancers (Classic ELB and ALB/NLB) |
| [Lambda](https://aws.amazon.com/lambda/) | Serverless function endpoints |
| [Lightsail](https://aws.amazon.com/lightsail/) | Lightsail instances (simplified VPS) |
| [Apigateway](https://aws.amazon.com/api-gateway/) | API endpoints deployed via Amazon API Gateway |
By covering these services, ProjectDiscovery can map out a broad range of AWS assets in your account. (Support for additional services may be added over time.)
**AWS Integration Methods**
ProjectDiscovery supports three methods to connect to AWS, each suited for different use cases and security preferences:
1. **Single AWS Account (Access Key & Secret)** – Direct credential-based authentication using an IAM User's Access Key ID and Secret Access Key to connect one AWS account. Choose this for quick setups or single-account monitoring.
2. **Multiple AWS Accounts (Assume Role)** – Use one set of credentials to assume roles in multiple accounts. This method is ideal for organizations with multiple AWS accounts (e.g. dev, prod, etc.). You provide one account's credentials and the common role name that exists in all target accounts.
3. **Cross-Account Role (Role ARN)** – Use a dedicated IAM role with an External ID for third-party access. This option lets you create a cross-account IAM role in your AWS account and grant ProjectDiscovery access via that role's Amazon Resource Name (ARN). This is the most secure integration method, as it follows AWS best practices for third-party account access.
**Prerequisites**
Before configuring the integration, make sure you have:
* **AWS Account** – Access to an AWS account where you can create IAM identities
* **Admin Access to IAM** – Permissions to create IAM users and roles
* **ProjectDiscovery Account** – Access to ProjectDiscovery's Cloud platform
* **Basic AWS IAM Knowledge** – Understanding of IAM users, access keys, and roles
#### 1. Single AWS Account (Access Key & Secret)
To connect a single AWS account directly:
1. **Create a Read-Only IAM User:** In the AWS IAM console, create a new IAM user for ProjectDiscovery integration. Assign **programmatic access** (which generates an Access Key ID and Secret Access Key).
2. **Attach Required Policies:** Grant the user read-only permissions to the AWS services you want to monitor. You can use AWS-managed policies like **AmazonEC2ReadOnlyAccess**, **AmazonS3ReadOnlyAccess**, etc. for each service (see the **Required Permissions** section below).
3. **Configure in ProjectDiscovery:**
* Select **Single AWS Account (Access Key & Secret)**
* Enter your **AWS Access Key ID** and **AWS Secret Access Key**
* Optionally provide a **Session Token** (only for temporary credentials)
* Give the integration a unique name
* Select the AWS services you want to monitor
*Tip:* Use an IAM user with minimal read-only permissions and rotate keys periodically for security.
#### 2. Multiple AWS Accounts (Assume Role)
For monitoring multiple AWS accounts from a central account:
1. **Choose a Primary Account:** Create an IAM user in one AWS account (the "primary") with programmatic access.
2. **Create an IAM Role in Each Target Account:** In each AWS account you want to monitor, create a role that:
* Uses the **same role name** across all accounts (e.g., "ProjectDiscoveryReadOnlyRole")
* Has a trust relationship allowing your primary account to assume it
* Has the required read-only permissions
3. **Configure in ProjectDiscovery:**
* Select **Multiple AWS Accounts (Assume Role)**
* Enter the primary account's **AWS Access Key ID** and **Secret Access Key**
* Specify the **Role Name to Assume** (the common role name)
* List all **AWS Account IDs** to monitor (one per line)
* Give the integration a unique name
* Select the AWS services you want to monitor
#### 3. Cross-Account Role (Role ARN)
The most secure method using ProjectDiscovery's service account:
1. **Create an IAM Role in Your AWS Account:**
* In your AWS console, go to IAM → Roles → Create Role
* Select "Another AWS account" as the trusted entity
* Enter ProjectDiscovery's ARN: `arn:aws:iam::034362060511:user/projectdiscovery`
* Enable "Require External ID" and enter the External ID shown in the ProjectDiscovery UI
* Attach the necessary read-only permissions
2. **Configure in ProjectDiscovery:**
* Select **Cross-Account Role (Role ARN)**
* Enter the **Role ARN** of the role you created
* Give the integration a unique name
* Select the AWS services you want to monitor
**Required Permissions**
ProjectDiscovery needs read-only access to your AWS assets. The following AWS-managed policies are recommended:
* EC2 - AmazonEC2ReadOnlyAccess
* Route53 - AmazonRoute53ReadOnlyAccess
* S3 - AmazonS3ReadOnlyAccess
* Lambda - AWSLambda\_ReadOnlyAccess
* ELB - ElasticLoadBalancingReadOnly
* Cloudfront - CloudFrontReadOnlyAccess
Alternatively, you can use this custom policy for minimal permissions:
```json theme={null}
{
"Version": "2012-10-17",
"Statement": [
{
"Sid": "RequiredReadPermissions",
"Effect": "Allow",
"Action": [
"ec2:DescribeInstances",
"ec2:DescribeRegions",
"route53:ListHostedZones",
"route53:ListResourceRecordSets",
"s3:ListAllMyBuckets",
"lambda:ListFunctions",
"elasticloadbalancing:DescribeLoadBalancers",
"elasticloadbalancing:DescribeTargetGroups",
"elasticloadbalancing:DescribeTargetHealth",
"cloudfront:ListDistributions",
"ecs:ListClusters",
"ecs:ListServices",
"ecs:ListTasks",
"ecs:DescribeTasks",
"ecs:DescribeContainerInstances",
"eks:ListClusters",
"eks:DescribeCluster",
"apigateway:GET",
"lightsail:GetInstances",
"lightsail:GetRegions"
],
"Resource": "*"
}
]
}
```
**Verifying the Integration**
After configuring the integration, it's important to verify that ProjectDiscovery is successfully connected and enumerating your AWS assets:
* **Check Asset Discovery:** In the ProjectDiscovery platform, navigate to the cloud assets or inventory section. After a successful integration, you should start seeing resources from your AWS account(s) listed (for example, EC2 instance IDs, S3 bucket names, etc., corresponding to the integrated accounts). It may take a short while for the initial discovery to complete. If you see those assets, the integration is working.
* **Test with a Known Resource:** As a quick test, pick a known resource (like a specific EC2 instance or S3 bucket in your AWS account) and search for it in ProjectDiscovery's asset inventory. If it appears, the connection is functioning and pulling data.
* **Troubleshooting Errors:** If the integration fails or some assets are missing, consider these common issues:
* *Incorrect Credentials:* Double-check that the Access Key and Secret (if used) were entered correctly and correspond to an active IAM user. If you recently created the user, ensure you copied the keys exactly (no extra spaces or missing characters).
* *Insufficient Permissions:* If certain services aren't showing up, the IAM policy might be missing permissions. For example, if S3 buckets aren't listed, confirm that the policy includes `s3:ListAllMyBuckets`. Refer back to the Required Permissions and make sure all relevant actions are allowed. You can also use AWS IAM Policy Simulator or CloudTrail logs to see if any **AccessDenied** errors occur when ProjectDiscovery calls AWS APIs.
* *Assume Role Failures:* In multi-account or cross-account setups, a common issue is a misconfigured trust relationship. If ProjectDiscovery cannot assume a role, you might see an error in the UI or logs like "AccessDenied: Not authorized to perform sts:AssumeRole". In that case, check the following:
* The trust policy of the IAM role (in target account) trusts the correct principal (either your primary account's IAM user/role ARN for multi-account, or ProjectDiscovery's external account ID for cross-account) and the External ID if applicable.
* The role name or ARN in the ProjectDiscovery config exactly matches the one in AWS (spelling/case must match).
* The primary credentials (for multi-account) have permission to call `AssumeRole`.
* *External ID Mismatch:* For cross-account roles, if the external ID in ProjectDiscovery and the one in the IAM role's trust policy do not match, AWS will deny the assume request. Ensure you didn't accidentally copy the wrong value or include extra spaces. It must be exact.
* **AWS CloudTrail Logs:** As an additional verification, you can check AWS CloudTrail in your account. When ProjectDiscovery connects, you should see events like `DescribeInstances`, `ListBuckets`, etc., being called by the IAM user or assumed role. For cross-account roles, you will see an `AssumeRole` event from ProjectDiscovery's AWS account ID, and subsequent calls under the assumed role's identity. This audit trail can confirm that the integration is working as intended and using only allowed actions.
If all checks out, ProjectDiscovery is now actively monitoring your AWS environment. New resources launched in AWS should be detected on the next scan cycle, and any changes to your cloud footprint will be reflected in the platform. Make sure to regularly review the integration and update the IAM permissions if you start using new AWS services.
**References:**
1. [https://docs.aws.amazon.com/IAM/latest/UserGuide/reference\_policies\_examples\_iam\_read-only-console.html](https://docs.aws.amazon.com/IAM/latest/UserGuide/reference_policies_examples_iam_read-only-console.html)
2. [https://docs.aws.amazon.com/IAM/latest/UserGuide/id\_credentials\_access-keys.html](https://docs.aws.amazon.com/IAM/latest/UserGuide/id_credentials_access-keys.html)
3. [https://docs.aws.amazon.com/IAM/latest/UserGuide/id\_credentials\_temp\_request.html](https://docs.aws.amazon.com/IAM/latest/UserGuide/id_credentials_temp_request.html)
4. [https://docs.aws.amazon.com/sdkref/latest/guide/feature-assume-role-credentials.html](https://docs.aws.amazon.com/sdkref/latest/guide/feature-assume-role-credentials.html)
5. [https://docs.logrhythm.com/OCbeats/docs/aws-cross-account-access-using-sts-assume-role](https://docs.logrhythm.com/OCbeats/docs/aws-cross-account-access-using-sts-assume-role)
### Google Cloud Platform (GCP)
Click here to open the GCP integration configuration page in the ProjectDiscovery Cloud platform
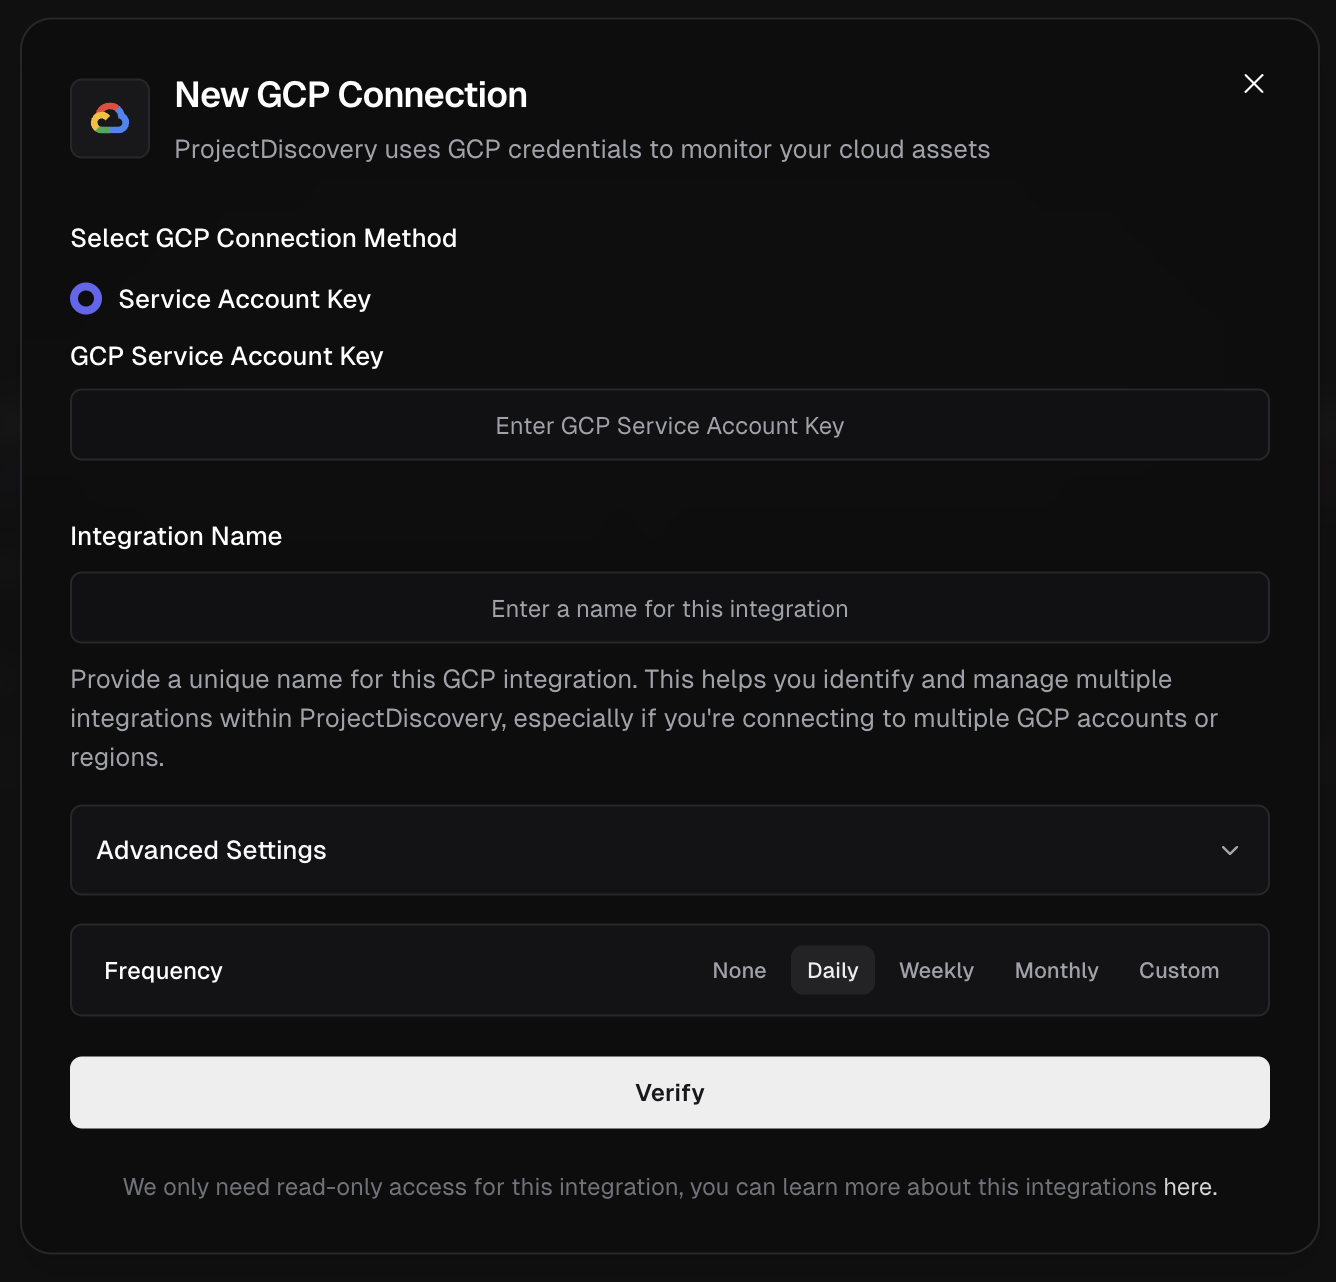
ProjectDiscovery's GCP integration allows the platform to automatically discover and monitor cloud assets across your GCP account. The integration supports **two discovery approaches** to accommodate different organizational structures and permission models.
 Supported GCP Services:
* [Cloud DNS](https://cloud.google.com/dns)
* [Kubernetes Engine](https://cloud.google.com/kubernetes-engine)
* [Compute Engine](https://cloud.google.com/products/compute)
* [Bucket](https://cloud.google.com/storage)
* [Cloud Functions](https://cloud.google.com/functions)
* [Cloud Run](https://cloud.google.com/run)
**GCP Integration Methods:**
1. **Organization-Level Asset API** (Recommended for Enterprises)
* Uses Google Cloud's **Asset Inventory API** for comprehensive organization-wide discovery
* Discovers assets across entire GCP organization with a single configuration
* Requires organization-level permissions: `roles/cloudasset.viewer` and `roles/resourcemanager.viewer`
* Ideal for large organizations with multiple projects
2. **Individual Service APIs** (Default)
* Uses individual GCP service APIs for project-specific discovery
* Faster execution with detailed resource metadata
* Requires project-level permissions for each service
* Ideal for focused, single-project discovery
### Multi-Organization Support
ProjectDiscovery supports monitoring **multiple GCP organizations simultaneously**. Simply configure multiple integrations with different organization IDs to get consolidated asset discovery across all your GCP environments (e.g., production, staging, development organizations).
### Finding Your Organization ID
1. **Via Google Cloud Console:**
* Go to the [Google Cloud Console](https://console.cloud.google.com/)
* In the top navigation, click on the **project selector** (next to "Google Cloud Platform")
* Click **All** tab to view all resources
* Look for your organization name - the **Organization ID** is displayed next to it
* Alternatively, go to [IAM & Admin > Settings](https://console.cloud.google.com/iam-admin/settings) - your Organization ID will be shown at the top
2. **Via gcloud CLI:**
```bash theme={null}
# List all organizations you have access to
gcloud organizations list
# Get current organization (if configured)
gcloud config get-value project
gcloud projects describe $(gcloud config get-value project) --format="value(parent.id)"
```
3. **Via Organization Policies Page:**
* Navigate to [Organization Policies](https://console.cloud.google.com/iam-admin/orgpolicies) in the Console
* Your Organization ID will be displayed in the URL and page header
### Checking Your Permissions
Before setting up the integration, verify you have the necessary permissions:
1. **For Organization-Level Integration:**
```bash theme={null}
# Check if you can list organization assets
gcloud organizations list
# Check if you have the required roles
gcloud organizations get-iam-policy YOUR_ORG_ID --flatten="bindings[].members" --format="table(bindings.role)" --filter="bindings.members:user:YOUR_EMAIL"
```
2. **For Project-Level Integration:**
```bash theme={null}
# Check project permissions
gcloud projects get-iam-policy YOUR_PROJECT_ID --flatten="bindings[].members" --format="table(bindings.role)" --filter="bindings.members:user:YOUR_EMAIL"
```
## Step-by-Step Setup Instructions
### Option 1: Organization-Level Asset API Setup
1. **Verify Organization Access:**
* Ensure you have `roles/cloudasset.viewer` and `roles/resourcemanager.viewer` at the organization level
* You can check this in [IAM & Admin > IAM](https://console.cloud.google.com/iam-admin/iam) by switching to your organization scope
2. **Create Service Account:**
* Navigate to any project within your organization
* Go to [IAM & Admin > Service Accounts](https://console.cloud.google.com/iam-admin/serviceaccounts)
* Click **Create Service Account**
* Name it something like `projectdiscovery-org-scanner`
* Click **Create and Continue**
3. **Grant Organization-Level Permissions:**
* Go to [IAM & Admin > IAM](https://console.cloud.google.com/iam-admin/iam)
* Switch to your **Organization** scope (not project)
* Click **Grant Access**
* Enter your service account email: `projectdiscovery-org-scanner@YOUR_PROJECT_ID.iam.gserviceaccount.com`
* Assign these roles:
* `Cloud Asset Viewer`
* `Organization Viewer`
* Click **Save**
4. **Generate Service Account Key:**
* Return to [Service Accounts](https://console.cloud.google.com/iam-admin/serviceaccounts)
* Click on your service account
* Go to **Keys** tab
* Click **Add Key > Create New Key**
* Choose **JSON** format
* Download and securely store the key file
### Option 2: Individual Service APIs Setup
1. **Select Target Project:**
* Choose the specific project you want to monitor
* Note the **Project ID** (not the display name)
2. **Create Service Account:**
* Navigate to [IAM & Admin > Service Accounts](https://console.cloud.google.com/iam-admin/serviceaccounts) in your target project
* Click **Create Service Account**
* Name it something like `projectdiscovery-scanner`
* Click **Create and Continue**
3. **Grant Project-Level Permissions:**
* On the same page, assign these roles:
* `Compute Viewer`
* `DNS Reader`
* `Storage Object Viewer`
* `Cloud Run Viewer`
* `Cloud Functions Viewer`
* `Kubernetes Engine Viewer`
* `Browser` (for basic project access)
* Click **Continue** and then **Done**
4. **Generate Service Account Key:**
* Click on your service account
* Go to **Keys** tab
* Click **Add Key > Create New Key**
* Choose **JSON** format
* Download and securely store the key file
References:
1. [https://cloud.google.com/iam/docs/service-account-overview](https://cloud.google.com/iam/docs/service-account-overview)
2. [https://cloud.google.com/iam/docs/keys-create-delete#creating](https://cloud.google.com/iam/docs/keys-create-delete#creating)
3. [https://cloud.google.com/asset-inventory/docs/overview](https://cloud.google.com/asset-inventory/docs/overview)
### Azure
Click here to open the Azure integration configuration page in the ProjectDiscovery Cloud platform
Supported GCP Services:
* [Cloud DNS](https://cloud.google.com/dns)
* [Kubernetes Engine](https://cloud.google.com/kubernetes-engine)
* [Compute Engine](https://cloud.google.com/products/compute)
* [Bucket](https://cloud.google.com/storage)
* [Cloud Functions](https://cloud.google.com/functions)
* [Cloud Run](https://cloud.google.com/run)
**GCP Integration Methods:**
1. **Organization-Level Asset API** (Recommended for Enterprises)
* Uses Google Cloud's **Asset Inventory API** for comprehensive organization-wide discovery
* Discovers assets across entire GCP organization with a single configuration
* Requires organization-level permissions: `roles/cloudasset.viewer` and `roles/resourcemanager.viewer`
* Ideal for large organizations with multiple projects
2. **Individual Service APIs** (Default)
* Uses individual GCP service APIs for project-specific discovery
* Faster execution with detailed resource metadata
* Requires project-level permissions for each service
* Ideal for focused, single-project discovery
### Multi-Organization Support
ProjectDiscovery supports monitoring **multiple GCP organizations simultaneously**. Simply configure multiple integrations with different organization IDs to get consolidated asset discovery across all your GCP environments (e.g., production, staging, development organizations).
### Finding Your Organization ID
1. **Via Google Cloud Console:**
* Go to the [Google Cloud Console](https://console.cloud.google.com/)
* In the top navigation, click on the **project selector** (next to "Google Cloud Platform")
* Click **All** tab to view all resources
* Look for your organization name - the **Organization ID** is displayed next to it
* Alternatively, go to [IAM & Admin > Settings](https://console.cloud.google.com/iam-admin/settings) - your Organization ID will be shown at the top
2. **Via gcloud CLI:**
```bash theme={null}
# List all organizations you have access to
gcloud organizations list
# Get current organization (if configured)
gcloud config get-value project
gcloud projects describe $(gcloud config get-value project) --format="value(parent.id)"
```
3. **Via Organization Policies Page:**
* Navigate to [Organization Policies](https://console.cloud.google.com/iam-admin/orgpolicies) in the Console
* Your Organization ID will be displayed in the URL and page header
### Checking Your Permissions
Before setting up the integration, verify you have the necessary permissions:
1. **For Organization-Level Integration:**
```bash theme={null}
# Check if you can list organization assets
gcloud organizations list
# Check if you have the required roles
gcloud organizations get-iam-policy YOUR_ORG_ID --flatten="bindings[].members" --format="table(bindings.role)" --filter="bindings.members:user:YOUR_EMAIL"
```
2. **For Project-Level Integration:**
```bash theme={null}
# Check project permissions
gcloud projects get-iam-policy YOUR_PROJECT_ID --flatten="bindings[].members" --format="table(bindings.role)" --filter="bindings.members:user:YOUR_EMAIL"
```
## Step-by-Step Setup Instructions
### Option 1: Organization-Level Asset API Setup
1. **Verify Organization Access:**
* Ensure you have `roles/cloudasset.viewer` and `roles/resourcemanager.viewer` at the organization level
* You can check this in [IAM & Admin > IAM](https://console.cloud.google.com/iam-admin/iam) by switching to your organization scope
2. **Create Service Account:**
* Navigate to any project within your organization
* Go to [IAM & Admin > Service Accounts](https://console.cloud.google.com/iam-admin/serviceaccounts)
* Click **Create Service Account**
* Name it something like `projectdiscovery-org-scanner`
* Click **Create and Continue**
3. **Grant Organization-Level Permissions:**
* Go to [IAM & Admin > IAM](https://console.cloud.google.com/iam-admin/iam)
* Switch to your **Organization** scope (not project)
* Click **Grant Access**
* Enter your service account email: `projectdiscovery-org-scanner@YOUR_PROJECT_ID.iam.gserviceaccount.com`
* Assign these roles:
* `Cloud Asset Viewer`
* `Organization Viewer`
* Click **Save**
4. **Generate Service Account Key:**
* Return to [Service Accounts](https://console.cloud.google.com/iam-admin/serviceaccounts)
* Click on your service account
* Go to **Keys** tab
* Click **Add Key > Create New Key**
* Choose **JSON** format
* Download and securely store the key file
### Option 2: Individual Service APIs Setup
1. **Select Target Project:**
* Choose the specific project you want to monitor
* Note the **Project ID** (not the display name)
2. **Create Service Account:**
* Navigate to [IAM & Admin > Service Accounts](https://console.cloud.google.com/iam-admin/serviceaccounts) in your target project
* Click **Create Service Account**
* Name it something like `projectdiscovery-scanner`
* Click **Create and Continue**
3. **Grant Project-Level Permissions:**
* On the same page, assign these roles:
* `Compute Viewer`
* `DNS Reader`
* `Storage Object Viewer`
* `Cloud Run Viewer`
* `Cloud Functions Viewer`
* `Kubernetes Engine Viewer`
* `Browser` (for basic project access)
* Click **Continue** and then **Done**
4. **Generate Service Account Key:**
* Click on your service account
* Go to **Keys** tab
* Click **Add Key > Create New Key**
* Choose **JSON** format
* Download and securely store the key file
References:
1. [https://cloud.google.com/iam/docs/service-account-overview](https://cloud.google.com/iam/docs/service-account-overview)
2. [https://cloud.google.com/iam/docs/keys-create-delete#creating](https://cloud.google.com/iam/docs/keys-create-delete#creating)
3. [https://cloud.google.com/asset-inventory/docs/overview](https://cloud.google.com/asset-inventory/docs/overview)
### Azure
Click here to open the Azure integration configuration page in the ProjectDiscovery Cloud platform
 Supported Azure Services:
* Virtual Machines
* Public IP Addresses
* Traffic Manager
* Storage Accounts
* Azure Kubernetes Service (AKS)
* Content Delivery Network (CDN)
* DNS Zones and Records
* Application Gateway & Load Balancer
* Container Instances
* App Service & Web Apps
* Azure Functions
* API Management
* Front Door
* Container Apps
* Static Web Apps
**Azure Integration Method:**
ProjectDiscovery Cloud Platform uses Microsoft's modern **Track 2 SDK** for Azure integration, providing enhanced security, performance, and support for the latest Azure services. The integration supports **6 authentication methods** to accommodate various cloud deployment scenarios while maintaining 100% backward compatibility with existing configurations.
### Quick Setup Options
**For most users (Service Principal method):**
Create an App Registration in Azure Active Directory with the following required credentials:
* Azure Tenant ID
* Azure Subscription ID
* Azure Client ID
* Azure Client Secret
Below are the steps to get the above credentials:
1. **Create App Registration:**
* Go to **Azure Active Directory > App registrations > + New registration**.
* From the app's **Overview** page, collect the **Application (client) ID** and **Directory (tenant) ID**.
2. **Generate Client Secret:**
* In the app, navigate to **Certificates & secrets > + New client secret**.
* **CRITICAL:** Copy the secret **Value** immediately, as it is shown only once.
3. **Assign Permissions:**
* Go to your **Subscription > Access control (IAM)**.
* Prefer a least-privilege custom role instead of the broad built-in Reader.
* Create a custom role (for example, "CloudList Reader") with minimal actions and then assign it to the App Registration you created. Example definition:
```json theme={null}
{
"properties": {
"roleName": "CloudList Reader",
"description": "Minimal permissions for CloudList to discover Azure resources including VMs, Storage, AKS, CDN, DNS, and more",
"assignableScopes": [
"/subscriptions/"
],
"permissions": [
{
"actions": [
"Microsoft.Resources/subscriptions/read",
"Microsoft.Resources/subscriptions/resourceGroups/read",
"Microsoft.Compute/virtualMachines/read",
"Microsoft.Network/networkInterfaces/read",
"Microsoft.Network/publicIPAddresses/read",
"Microsoft.Network/trafficManagerProfiles/read",
"Microsoft.Storage/storageAccounts/read",
"Microsoft.ContainerService/managedClusters/read",
"Microsoft.Cdn/profiles/read",
"Microsoft.Cdn/profiles/endpoints/read",
"Microsoft.Network/dnszones/read",
"Microsoft.Network/dnszones/recordsets/read",
"Microsoft.Network/applicationGateways/read",
"Microsoft.Network/loadBalancers/read",
"Microsoft.ContainerInstance/containerGroups/read",
"Microsoft.Web/sites/read",
"Microsoft.Web/sites/functions/read",
"Microsoft.ApiManagement/service/read",
"Microsoft.Network/frontDoors/read",
"Microsoft.App/containerApps/read",
"Microsoft.Web/staticSites/read"
],
"notActions": [],
"dataActions": [],
"notDataActions": []
}
]
}
}
```
* If you only need specific services, you can further reduce actions. For example:
* Virtual machines: `Microsoft.Compute/virtualMachines/read`, plus RG/subscription reads
* Public IPs: `Microsoft.Network/publicIPAddresses/read`
* Traffic Manager: `Microsoft.Network/trafficManagerProfiles/read`
* Storage Accounts: `Microsoft.Storage/storageAccounts/read`
* AKS Clusters: `Microsoft.ContainerService/managedClusters/read`
* CDN: `Microsoft.Cdn/profiles/read`, `Microsoft.Cdn/profiles/endpoints/read`
* DNS: `Microsoft.Network/dnszones/read`, `Microsoft.Network/dnszones/recordsets/read`
* App Services: `Microsoft.Web/sites/read`
* Functions: `Microsoft.Web/sites/functions/read`
* Container Apps: `Microsoft.App/containerApps/read`
* After creating the role, assign it to the App Registration under Role assignments.
* Alternatively, if creating custom roles is not feasible in your environment, you may assign the built-in **Reader** role to the App Registration. This provides broader read access across the subscription and may exceed least-privilege needs.
* Note your **Subscription ID** from the subscription's overview page.
4. **Connect:**
* Enter the four collected credentials (Tenant ID, Client ID, Client Secret, and Subscription ID) into ProjectDiscovery Cloud Platform to configure the integration.
References:
1. [https://docs.microsoft.com/en-us/azure/active-directory/develop/howto-create-service-principal-portal](https://docs.microsoft.com/en-us/azure/active-directory/develop/howto-create-service-principal-portal)
2. [https://learn.microsoft.com/en-us/azure/role-based-access-control/custom-roles-portal](https://learn.microsoft.com/en-us/azure/role-based-access-control/custom-roles-portal)
3. [https://learn.microsoft.com/en-us/azure/active-directory/develop/app-objects-and-service-principals](https://learn.microsoft.com/en-us/azure/active-directory/develop/app-objects-and-service-principals)
### Alibaba Cloud
Click here to open the Alibaba Cloud integration configuration page in the ProjectDiscovery Cloud platform
Supported Azure Services:
* Virtual Machines
* Public IP Addresses
* Traffic Manager
* Storage Accounts
* Azure Kubernetes Service (AKS)
* Content Delivery Network (CDN)
* DNS Zones and Records
* Application Gateway & Load Balancer
* Container Instances
* App Service & Web Apps
* Azure Functions
* API Management
* Front Door
* Container Apps
* Static Web Apps
**Azure Integration Method:**
ProjectDiscovery Cloud Platform uses Microsoft's modern **Track 2 SDK** for Azure integration, providing enhanced security, performance, and support for the latest Azure services. The integration supports **6 authentication methods** to accommodate various cloud deployment scenarios while maintaining 100% backward compatibility with existing configurations.
### Quick Setup Options
**For most users (Service Principal method):**
Create an App Registration in Azure Active Directory with the following required credentials:
* Azure Tenant ID
* Azure Subscription ID
* Azure Client ID
* Azure Client Secret
Below are the steps to get the above credentials:
1. **Create App Registration:**
* Go to **Azure Active Directory > App registrations > + New registration**.
* From the app's **Overview** page, collect the **Application (client) ID** and **Directory (tenant) ID**.
2. **Generate Client Secret:**
* In the app, navigate to **Certificates & secrets > + New client secret**.
* **CRITICAL:** Copy the secret **Value** immediately, as it is shown only once.
3. **Assign Permissions:**
* Go to your **Subscription > Access control (IAM)**.
* Prefer a least-privilege custom role instead of the broad built-in Reader.
* Create a custom role (for example, "CloudList Reader") with minimal actions and then assign it to the App Registration you created. Example definition:
```json theme={null}
{
"properties": {
"roleName": "CloudList Reader",
"description": "Minimal permissions for CloudList to discover Azure resources including VMs, Storage, AKS, CDN, DNS, and more",
"assignableScopes": [
"/subscriptions/"
],
"permissions": [
{
"actions": [
"Microsoft.Resources/subscriptions/read",
"Microsoft.Resources/subscriptions/resourceGroups/read",
"Microsoft.Compute/virtualMachines/read",
"Microsoft.Network/networkInterfaces/read",
"Microsoft.Network/publicIPAddresses/read",
"Microsoft.Network/trafficManagerProfiles/read",
"Microsoft.Storage/storageAccounts/read",
"Microsoft.ContainerService/managedClusters/read",
"Microsoft.Cdn/profiles/read",
"Microsoft.Cdn/profiles/endpoints/read",
"Microsoft.Network/dnszones/read",
"Microsoft.Network/dnszones/recordsets/read",
"Microsoft.Network/applicationGateways/read",
"Microsoft.Network/loadBalancers/read",
"Microsoft.ContainerInstance/containerGroups/read",
"Microsoft.Web/sites/read",
"Microsoft.Web/sites/functions/read",
"Microsoft.ApiManagement/service/read",
"Microsoft.Network/frontDoors/read",
"Microsoft.App/containerApps/read",
"Microsoft.Web/staticSites/read"
],
"notActions": [],
"dataActions": [],
"notDataActions": []
}
]
}
}
```
* If you only need specific services, you can further reduce actions. For example:
* Virtual machines: `Microsoft.Compute/virtualMachines/read`, plus RG/subscription reads
* Public IPs: `Microsoft.Network/publicIPAddresses/read`
* Traffic Manager: `Microsoft.Network/trafficManagerProfiles/read`
* Storage Accounts: `Microsoft.Storage/storageAccounts/read`
* AKS Clusters: `Microsoft.ContainerService/managedClusters/read`
* CDN: `Microsoft.Cdn/profiles/read`, `Microsoft.Cdn/profiles/endpoints/read`
* DNS: `Microsoft.Network/dnszones/read`, `Microsoft.Network/dnszones/recordsets/read`
* App Services: `Microsoft.Web/sites/read`
* Functions: `Microsoft.Web/sites/functions/read`
* Container Apps: `Microsoft.App/containerApps/read`
* After creating the role, assign it to the App Registration under Role assignments.
* Alternatively, if creating custom roles is not feasible in your environment, you may assign the built-in **Reader** role to the App Registration. This provides broader read access across the subscription and may exceed least-privilege needs.
* Note your **Subscription ID** from the subscription's overview page.
4. **Connect:**
* Enter the four collected credentials (Tenant ID, Client ID, Client Secret, and Subscription ID) into ProjectDiscovery Cloud Platform to configure the integration.
References:
1. [https://docs.microsoft.com/en-us/azure/active-directory/develop/howto-create-service-principal-portal](https://docs.microsoft.com/en-us/azure/active-directory/develop/howto-create-service-principal-portal)
2. [https://learn.microsoft.com/en-us/azure/role-based-access-control/custom-roles-portal](https://learn.microsoft.com/en-us/azure/role-based-access-control/custom-roles-portal)
3. [https://learn.microsoft.com/en-us/azure/active-directory/develop/app-objects-and-service-principals](https://learn.microsoft.com/en-us/azure/active-directory/develop/app-objects-and-service-principals)
### Alibaba Cloud
Click here to open the Alibaba Cloud integration configuration page in the ProjectDiscovery Cloud platform
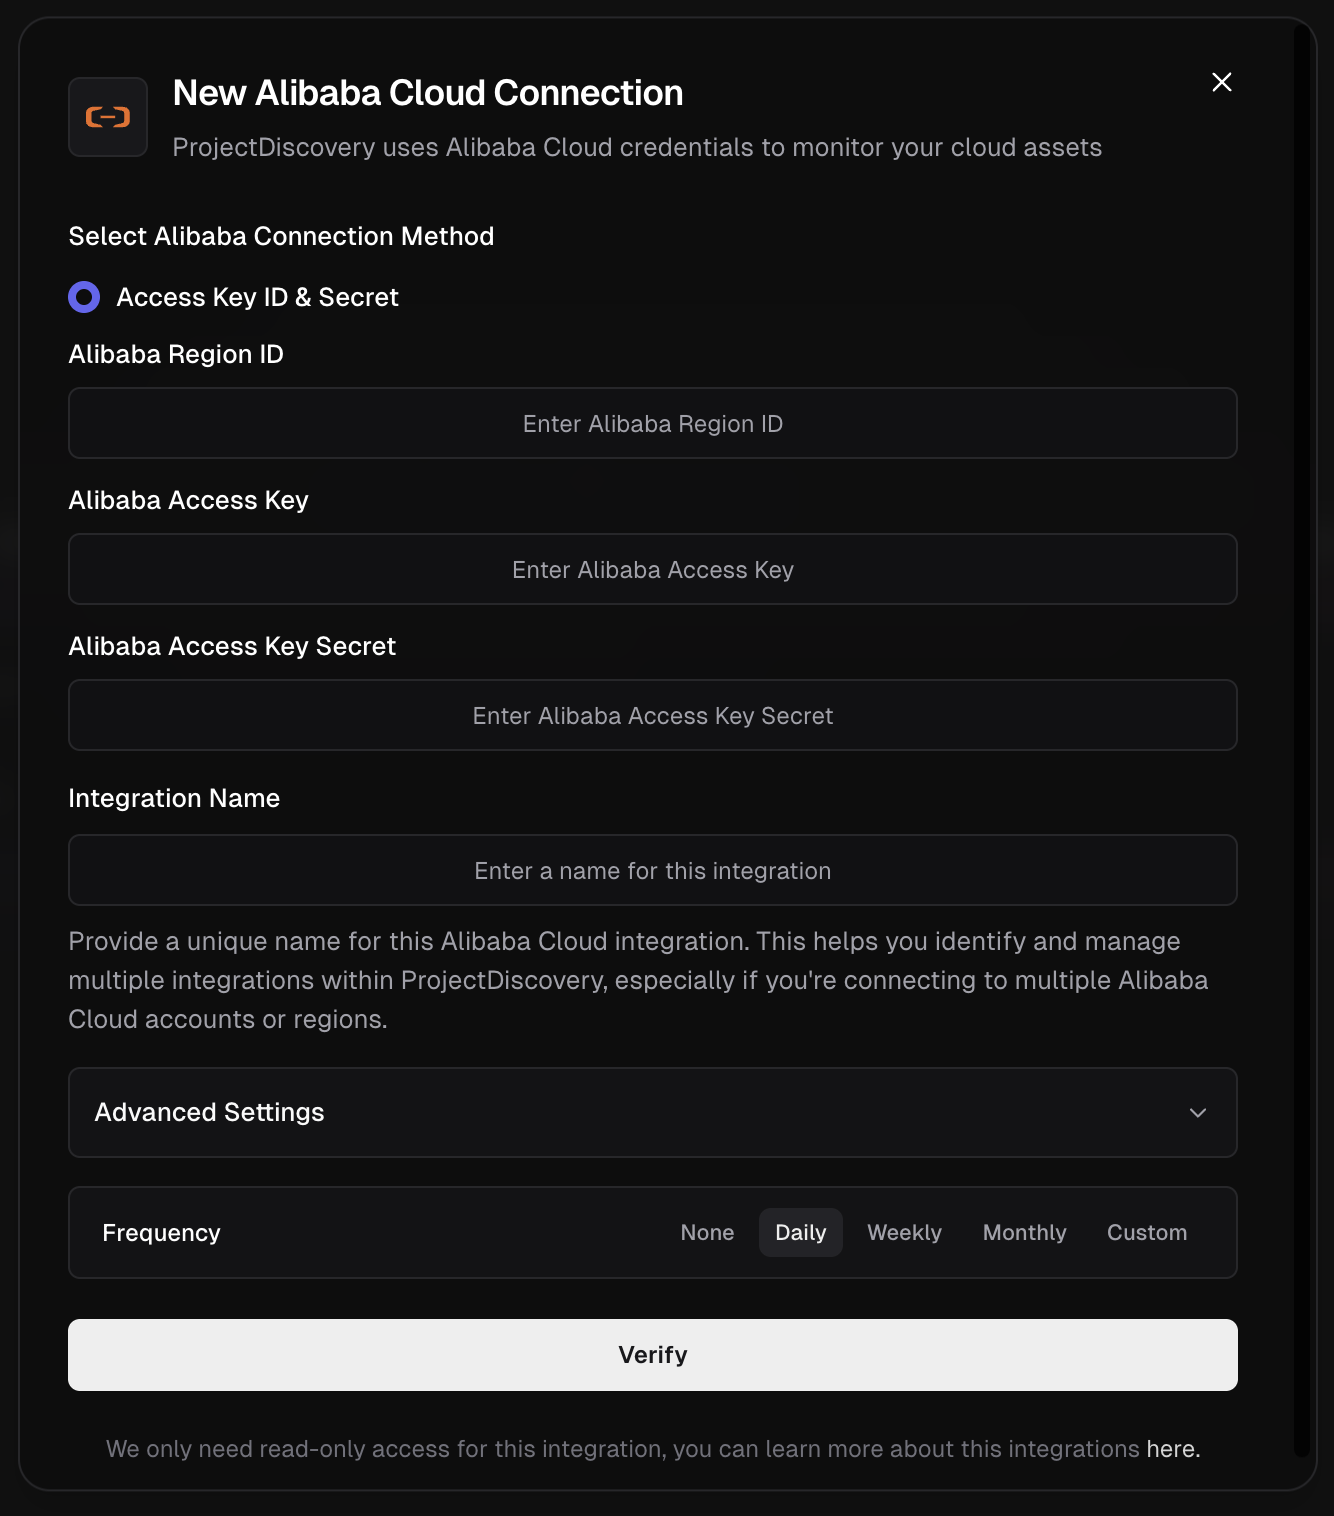 Supported Alibaba Cloud Services:
* ECS Instances
**Alibaba Integration Method**
This guide details the secure, best-practice method for connecting to Alibaba Cloud using a dedicated RAM user with read-only permissions.
1. **Create a RAM User for API Access:**
* Navigate to the **RAM (Resource Access Management) console**. [Ref](https://ram.console.aliyun.com/manage/ak)
* From the left menu, go to **Identities > Users** and click **Create User**.
* Enter a **Logon Name** (e.g., `projectdiscovery-readonly`).
* For **Access Mode**, select **OpenAPI Access** and click **OK**. This is for programmatic access, not console login.
2. **Securely Store the Access Key**: An AccessKey pair is generated immediately after the user is created. This is the only time the secret is shown.
On the confirmation screen, copy the **AccessKey ID** and the **AccessKey Secret**. Store them in a secure location immediately. The secret cannot be retrieved after you close this dialog.
3. **Grant Read-Only Permissions:**
* Return to the **Users** list.
* Find the user you just created and click **Add Permissions** in the *Actions* column.
* Select the **System Policy** type.
* Search for and select the `AliyunReadOnlyAccess` policy and click **OK**. This is the official, managed policy for read-only access to all cloud resources.
4. **Find Your Region ID and Connect:**
* Identify the **Region ID** for the resources you plan to monitor. You can find the official list in the Alibaba Cloud documentation here: [Regions and zones](https://www.alibabacloud.com/help/en/doc-detail/40654.htm) (This link lists the specific IDs required for API configuration).
* Use the credentials you have collected to fill in the fields in ProjectDiscovery:
* **Alibaba Region ID**: The target region, for example, `us-east-1`.
* **Alibaba Access Key**: The AccessKey ID from Step 2.
* **Alibaba Access Key Secret**: The AccessKey Secret from Step 2.
* Enter a unique **Integration Name** and click **Verify**.
References:
1. [https://www.alibabacloud.com/help/faq-detail/142101.htm](https://www.alibabacloud.com/help/faq-detail/142101.htm)
2. [https://www.alibabacloud.com/help/doc-detail/53045.htm](https://www.alibabacloud.com/help/doc-detail/53045.htm)
### Kubernetes
Click here to open the Kubernetes integration configuration page in the ProjectDiscovery Cloud platform
Supported Alibaba Cloud Services:
* ECS Instances
**Alibaba Integration Method**
This guide details the secure, best-practice method for connecting to Alibaba Cloud using a dedicated RAM user with read-only permissions.
1. **Create a RAM User for API Access:**
* Navigate to the **RAM (Resource Access Management) console**. [Ref](https://ram.console.aliyun.com/manage/ak)
* From the left menu, go to **Identities > Users** and click **Create User**.
* Enter a **Logon Name** (e.g., `projectdiscovery-readonly`).
* For **Access Mode**, select **OpenAPI Access** and click **OK**. This is for programmatic access, not console login.
2. **Securely Store the Access Key**: An AccessKey pair is generated immediately after the user is created. This is the only time the secret is shown.
On the confirmation screen, copy the **AccessKey ID** and the **AccessKey Secret**. Store them in a secure location immediately. The secret cannot be retrieved after you close this dialog.
3. **Grant Read-Only Permissions:**
* Return to the **Users** list.
* Find the user you just created and click **Add Permissions** in the *Actions* column.
* Select the **System Policy** type.
* Search for and select the `AliyunReadOnlyAccess` policy and click **OK**. This is the official, managed policy for read-only access to all cloud resources.
4. **Find Your Region ID and Connect:**
* Identify the **Region ID** for the resources you plan to monitor. You can find the official list in the Alibaba Cloud documentation here: [Regions and zones](https://www.alibabacloud.com/help/en/doc-detail/40654.htm) (This link lists the specific IDs required for API configuration).
* Use the credentials you have collected to fill in the fields in ProjectDiscovery:
* **Alibaba Region ID**: The target region, for example, `us-east-1`.
* **Alibaba Access Key**: The AccessKey ID from Step 2.
* **Alibaba Access Key Secret**: The AccessKey Secret from Step 2.
* Enter a unique **Integration Name** and click **Verify**.
References:
1. [https://www.alibabacloud.com/help/faq-detail/142101.htm](https://www.alibabacloud.com/help/faq-detail/142101.htm)
2. [https://www.alibabacloud.com/help/doc-detail/53045.htm](https://www.alibabacloud.com/help/doc-detail/53045.htm)
### Kubernetes
Click here to open the Kubernetes integration configuration page in the ProjectDiscovery Cloud platform
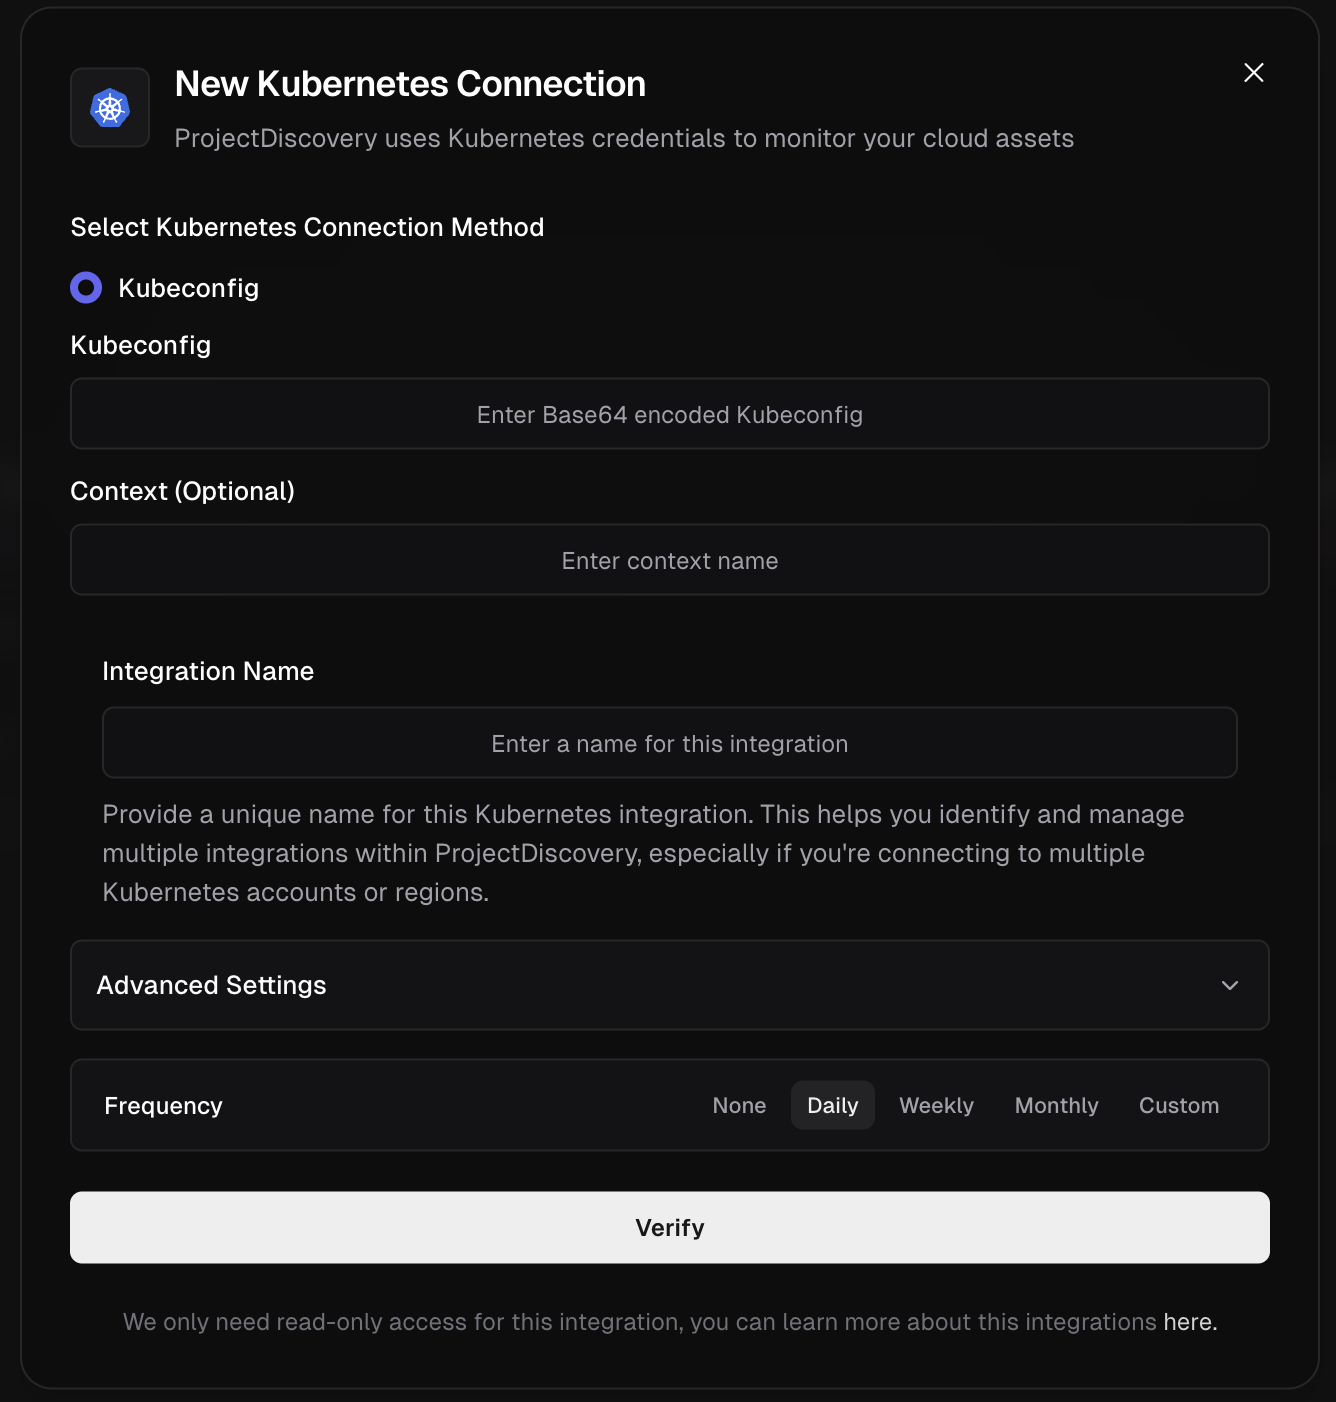 Supported Kubernetes Services:
* Services
* Ingresses
* Cross-cloud cluster discovery
**Public/External Access Required**: Kubernetes integration only works with clusters that are publicly accessible or have external endpoints. Internal-only clusters (accessible only within private networks) will fail to integrate as ProjectDiscovery cannot reach them from the cloud platform.
**Kubernetes Integration Method**
**Cluster Accessibility**: Before attempting integration, ensure your Kubernetes cluster has public/external endpoints that ProjectDiscovery can access. This includes:
* Publicly accessible API servers
* External load balancers exposing services
* Internet-facing ingress controllers
* Clusters with public IP addresses
1. **Prepare Base64-Encoded Kubeconfig**
* Your kubeconfig file is typically located at:
```
~/.kube/config
```
* Encode it using:
```
cat ~/.kube/config | base64
```
* Paste the output into the **Kubeconfig** field in the UI.
> ⚠️ Ensure the entire content is copied without extra whitespace.
2. **Specify Context (Optional)**
* If your kubeconfig has multiple contexts, find them with:
```
kubectl config get-contexts
```
* To view the current context:
```
kubectl config current-context
```
* Use the relevant context name if required.
3. **Define Integration Name & Verify**
Choose a unique, descriptive name for this integration and click **Verify** to complete the integration.
**Troubleshooting Integration Failures**
If your Kubernetes integration fails, the most common cause is cluster accessibility:
* **Internal Clusters**: Clusters only accessible within private networks (VPN, internal VPCs) cannot be reached by ProjectDiscovery
* **Firewall Restrictions**: Ensure your cluster's API server and services are accessible from the internet
* **Network Policies**: Check that network policies allow external access to required endpoints
* **Load Balancer Configuration**: Verify that external load balancers are properly configured and accessible
**Alternative for Internal Clusters**: For internal-only Kubernetes clusters, consider using the cloud provider integration (AWS EKS, GCP GKE, Azure AKS) which can discover cluster endpoints through the cloud provider's APIs, or manually add the cluster's external endpoints as assets.
References
1. [https://kubernetes.io/docs/concepts/configuration/organize-cluster-access-kubeconfig/](https://kubernetes.io/docs/concepts/configuration/organize-cluster-access-kubeconfig/)
### Cloudflare
Click here to open the Cloudflare integration configuration page in the ProjectDiscovery Cloud platform
Supported Kubernetes Services:
* Services
* Ingresses
* Cross-cloud cluster discovery
**Public/External Access Required**: Kubernetes integration only works with clusters that are publicly accessible or have external endpoints. Internal-only clusters (accessible only within private networks) will fail to integrate as ProjectDiscovery cannot reach them from the cloud platform.
**Kubernetes Integration Method**
**Cluster Accessibility**: Before attempting integration, ensure your Kubernetes cluster has public/external endpoints that ProjectDiscovery can access. This includes:
* Publicly accessible API servers
* External load balancers exposing services
* Internet-facing ingress controllers
* Clusters with public IP addresses
1. **Prepare Base64-Encoded Kubeconfig**
* Your kubeconfig file is typically located at:
```
~/.kube/config
```
* Encode it using:
```
cat ~/.kube/config | base64
```
* Paste the output into the **Kubeconfig** field in the UI.
> ⚠️ Ensure the entire content is copied without extra whitespace.
2. **Specify Context (Optional)**
* If your kubeconfig has multiple contexts, find them with:
```
kubectl config get-contexts
```
* To view the current context:
```
kubectl config current-context
```
* Use the relevant context name if required.
3. **Define Integration Name & Verify**
Choose a unique, descriptive name for this integration and click **Verify** to complete the integration.
**Troubleshooting Integration Failures**
If your Kubernetes integration fails, the most common cause is cluster accessibility:
* **Internal Clusters**: Clusters only accessible within private networks (VPN, internal VPCs) cannot be reached by ProjectDiscovery
* **Firewall Restrictions**: Ensure your cluster's API server and services are accessible from the internet
* **Network Policies**: Check that network policies allow external access to required endpoints
* **Load Balancer Configuration**: Verify that external load balancers are properly configured and accessible
**Alternative for Internal Clusters**: For internal-only Kubernetes clusters, consider using the cloud provider integration (AWS EKS, GCP GKE, Azure AKS) which can discover cluster endpoints through the cloud provider's APIs, or manually add the cluster's external endpoints as assets.
References
1. [https://kubernetes.io/docs/concepts/configuration/organize-cluster-access-kubeconfig/](https://kubernetes.io/docs/concepts/configuration/organize-cluster-access-kubeconfig/)
### Cloudflare
Click here to open the Cloudflare integration configuration page in the ProjectDiscovery Cloud platform
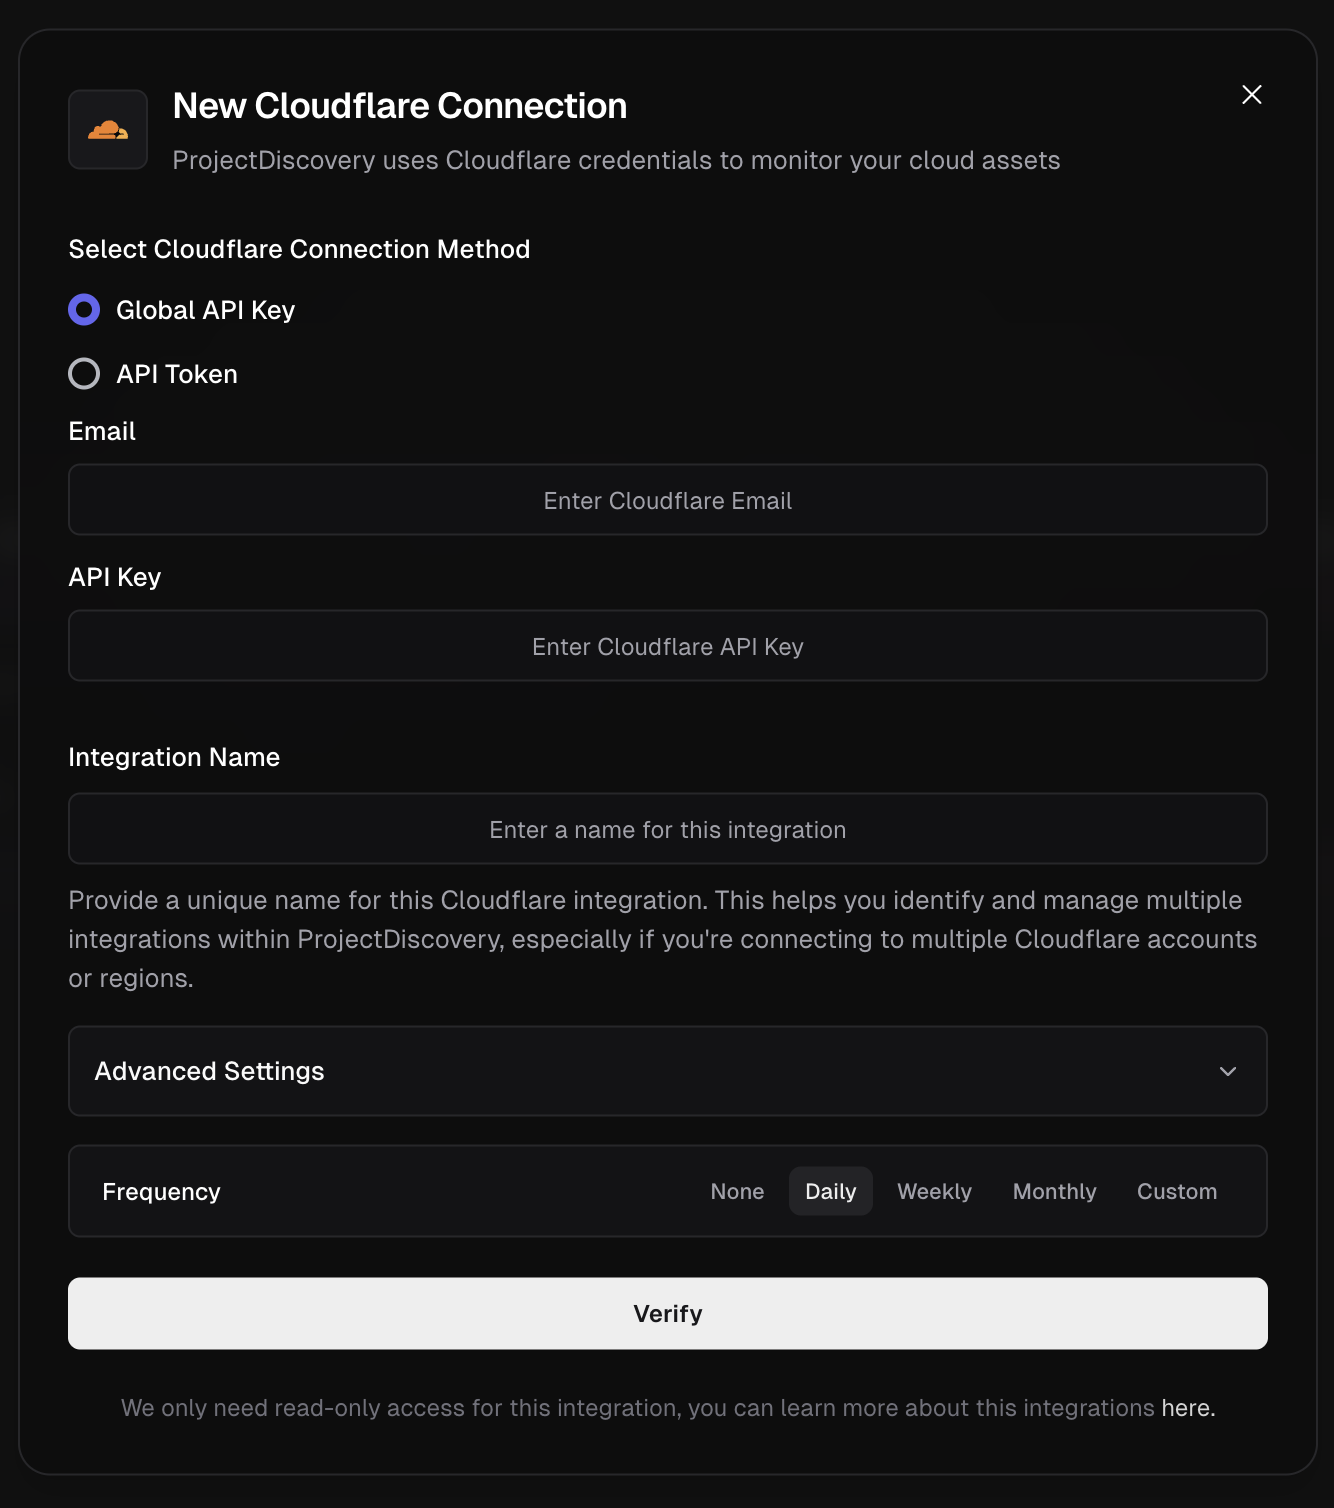 Supported Cloudflare Services:
* DNS and CDN assets
**Cloudflare Integration Methods:**
You can integrate Cloudflare into ProjectDiscovery via one of two methods:
1. **Global API Key**
* Go to Cloudflare Dashboard.
* Under "API Keys", locate the **Global API Key** and click **View.**
* Authenticate and copy the key.
* Now enter the Cloudflare account email and Global API Key copied in above step into ProjectDiscovery Cloud Platform.
* Give a unique Integration name and click **Verify**.
2. **API Token**
* From the [Cloudflare dashboard ↗](https://dash.cloudflare.com/profile/api-tokens/), go to **My Profile** > **API Tokens** for user tokens. For Account Tokens, go to **Manage Account** > **API Tokens**.
* Select **Create Token**.
* Give required permission (follow reference 2 for details) and create token. Copy the Token
* Now enter API Token in ProjectDiscovery Cloud Platform.
* Give a unique Integration name and click **Verify**.
References:
1. [https://developers.cloudflare.com/api/keys](https://developers.cloudflare.com/api/keys)
2. [https://developers.cloudflare.com/fundamentals/api/get-started/create-token/](https://developers.cloudflare.com/fundamentals/api/get-started/create-token/)
### Fastly
Click here to open the Fastly integration configuration page in the ProjectDiscovery Cloud platform
Supported Cloudflare Services:
* DNS and CDN assets
**Cloudflare Integration Methods:**
You can integrate Cloudflare into ProjectDiscovery via one of two methods:
1. **Global API Key**
* Go to Cloudflare Dashboard.
* Under "API Keys", locate the **Global API Key** and click **View.**
* Authenticate and copy the key.
* Now enter the Cloudflare account email and Global API Key copied in above step into ProjectDiscovery Cloud Platform.
* Give a unique Integration name and click **Verify**.
2. **API Token**
* From the [Cloudflare dashboard ↗](https://dash.cloudflare.com/profile/api-tokens/), go to **My Profile** > **API Tokens** for user tokens. For Account Tokens, go to **Manage Account** > **API Tokens**.
* Select **Create Token**.
* Give required permission (follow reference 2 for details) and create token. Copy the Token
* Now enter API Token in ProjectDiscovery Cloud Platform.
* Give a unique Integration name and click **Verify**.
References:
1. [https://developers.cloudflare.com/api/keys](https://developers.cloudflare.com/api/keys)
2. [https://developers.cloudflare.com/fundamentals/api/get-started/create-token/](https://developers.cloudflare.com/fundamentals/api/get-started/create-token/)
### Fastly
Click here to open the Fastly integration configuration page in the ProjectDiscovery Cloud platform
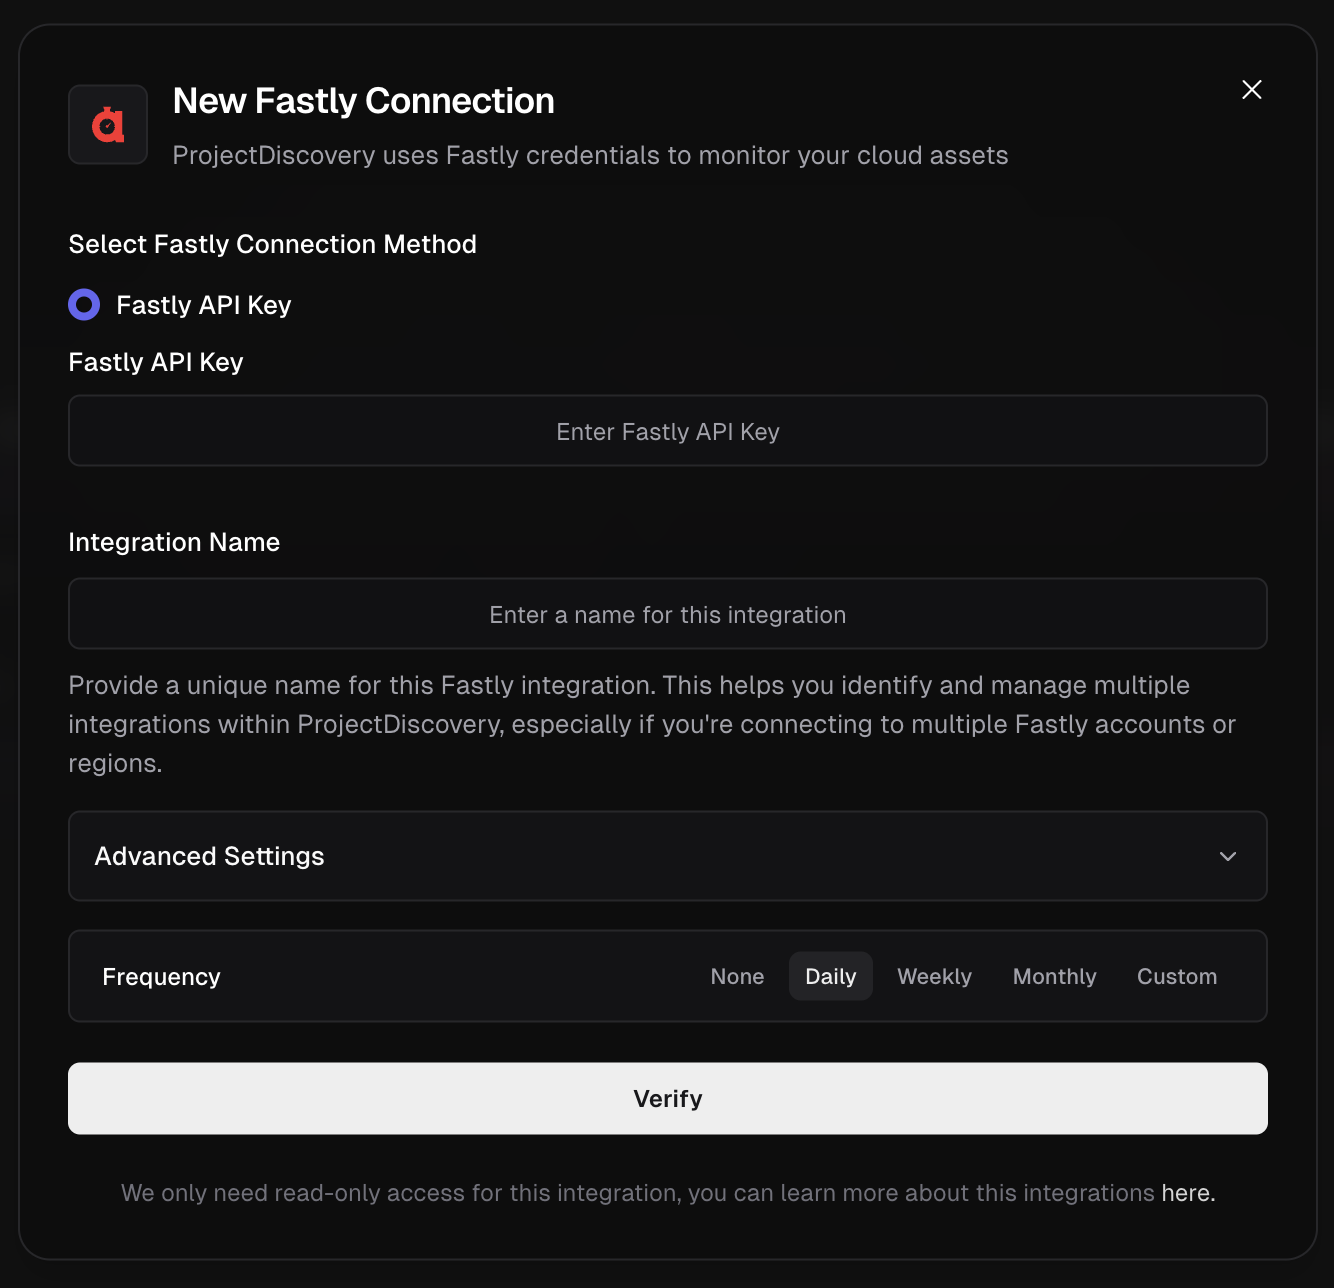 **Fastly Integration Method**
* Go to Fastly [account settings](https://manage.fastly.com/account/personal).
* Under **API**, click **Create API token** if you don’t already have one.
* Copy the API Key.
* Now enter API Key in ProjectDiscovery Cloud Platform.
* Give a unique Integration name and click **Verify**.
Tip: In Fastly's documentation and interfaces, "API Key" and "API Token" refer to the same thing. You can use the terms interchangeably throughout this guide.
References:
1. [https://docs.fastly.com/en/guides/using-api-tokens#creating-api-tokens](https://docs.fastly.com/en/guides/using-api-tokens#creating-api-tokens)
### DigitalOcean
Click here to open the DigitalOcean integration configuration page in the ProjectDiscovery Cloud platform
**Fastly Integration Method**
* Go to Fastly [account settings](https://manage.fastly.com/account/personal).
* Under **API**, click **Create API token** if you don’t already have one.
* Copy the API Key.
* Now enter API Key in ProjectDiscovery Cloud Platform.
* Give a unique Integration name and click **Verify**.
Tip: In Fastly's documentation and interfaces, "API Key" and "API Token" refer to the same thing. You can use the terms interchangeably throughout this guide.
References:
1. [https://docs.fastly.com/en/guides/using-api-tokens#creating-api-tokens](https://docs.fastly.com/en/guides/using-api-tokens#creating-api-tokens)
### DigitalOcean
Click here to open the DigitalOcean integration configuration page in the ProjectDiscovery Cloud platform
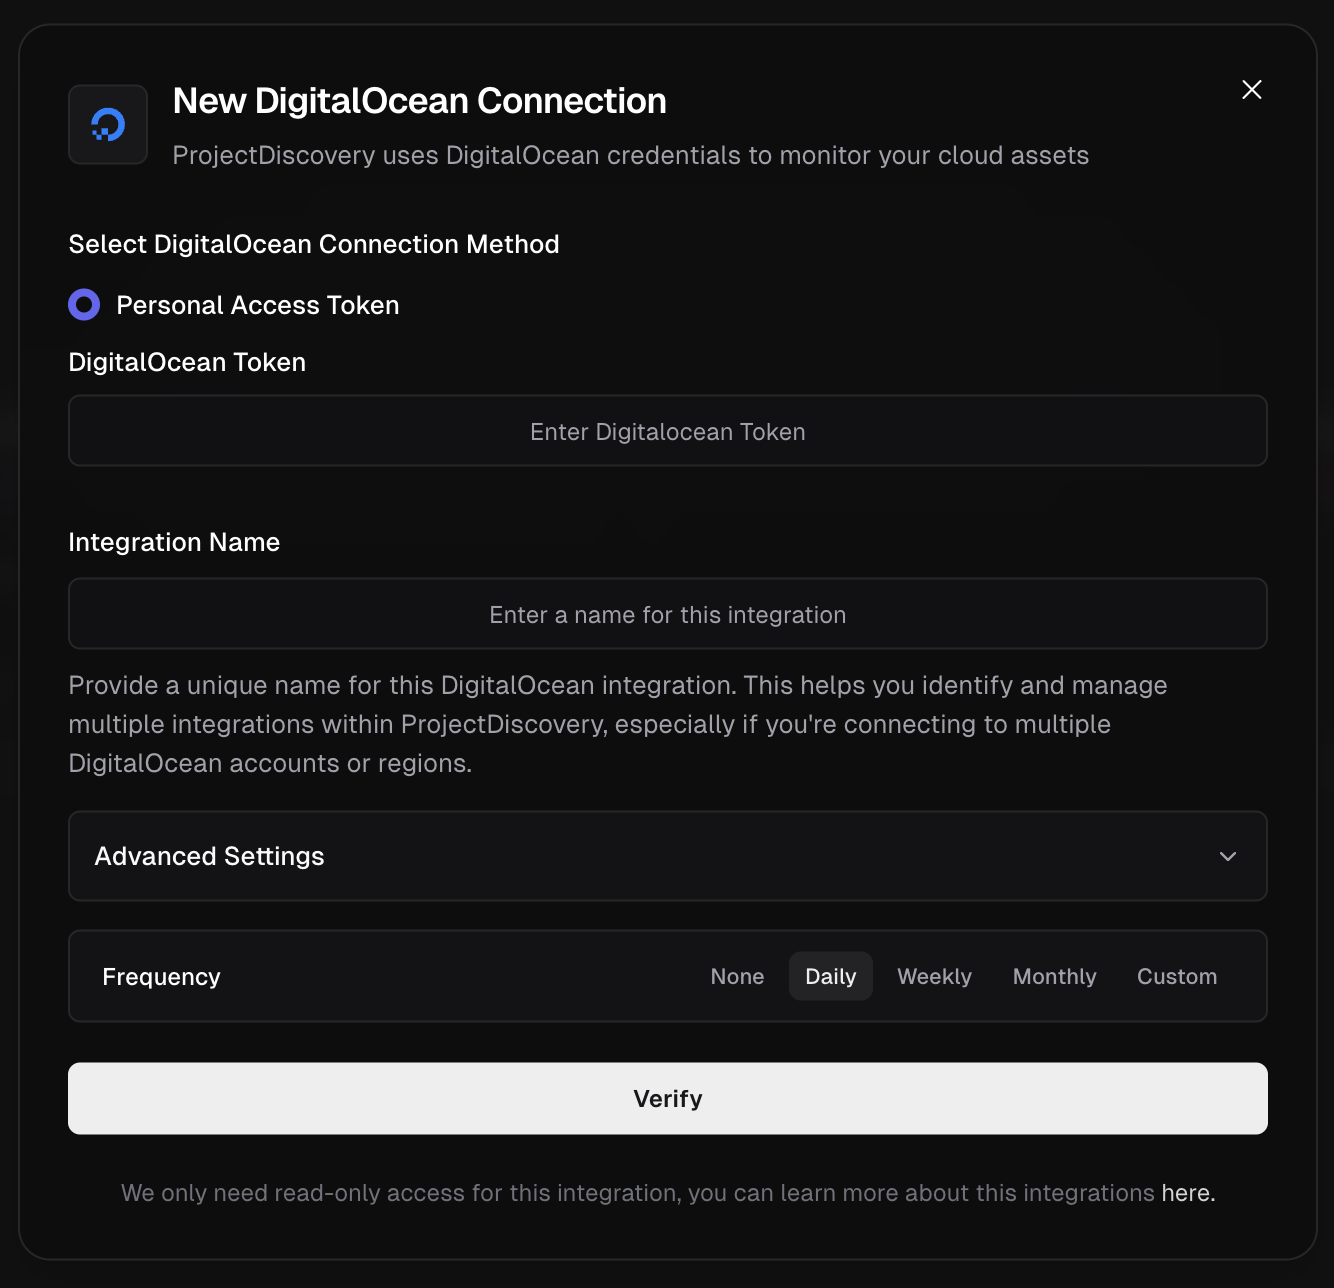 **DigitalOcean Integration Method**
* Go to DigitalOcean [API Settings](https://cloud.digitalocean.com/account/api/tokens).
* Click **Generate New Token**
* Provide a name and enable **read-only** access scope
* Copy the token
* Now enter token in ProjectDiscovery Cloud Platform.
* Give a unique Integration name and click **Verify**.
Supported Services:
* Droplets and managed services
References:
1. [https://docs.digitalocean.com/reference/api/create-personal-access-token/](https://docs.digitalocean.com/reference/api/create-personal-access-token/)
2. [https://docs.digitalocean.com/reference/api/](https://docs.digitalocean.com/reference/api/)
**DigitalOcean Integration Method**
* Go to DigitalOcean [API Settings](https://cloud.digitalocean.com/account/api/tokens).
* Click **Generate New Token**
* Provide a name and enable **read-only** access scope
* Copy the token
* Now enter token in ProjectDiscovery Cloud Platform.
* Give a unique Integration name and click **Verify**.
Supported Services:
* Droplets and managed services
References:
1. [https://docs.digitalocean.com/reference/api/create-personal-access-token/](https://docs.digitalocean.com/reference/api/create-personal-access-token/)
2. [https://docs.digitalocean.com/reference/api/](https://docs.digitalocean.com/reference/api/)